
Are you looking for an essay on the ‘Spectroscopy and Its Types’? Find paragraphs, long and short essays on the ‘Spectroscopy and Its Types’ especially written for school and college students.
Essay # 1. Introduction to Spectroscopy:
Spectroscopy is the study of spectra, i.e. characteristic wavelengths or colours. Physicists classify light waves by their energies (wavelengths). Electromagnetic radiation such as visible light is commonly treated as a wave phenomenon, characterized by a wavelength or frequency. Wavelength (λ) is defined as the distance between adjacent peaks (or troughs), and may be designated in meters, centimeters or nanometers (10–9 meters). Frequency (v) is the number of wave cycles that travel past a fixed point per unit of time, and is usually given in cycles per second, or hertz (Hz).
Visible wavelengths cover a range from approximately 400 to 800 nm. The longest visible wavelength is red and the shortest is violet. The energy of a light wave is inversely-proportional to its wavelength; in other words, low-energy waves have long wavelengths, and high-energy light waves have short wavelengths. The energy of a light wave is inversely-proportional to its wavelength; in other words, low-energy waves have long wavelengths, and high-energy light waves have short wavelengths (E=hv = hc/λ, where h is the Planks constant)
Many molecules absorb ultraviolet or visible light. The visible region of the spectrum comprises photon energies of 36 to 72 kcal/mole and the near ultraviolet region, out to 200 nm, extends this energy range to 143 kcal/mole. Ultraviolet radiation having wavelengths less than 200 nm is difficult to handle, and is seldom used as a routine tool for structural analysis. Different molecules absorb radiation of different wavelengths. An absorption spectrum will show a number of absorption bands corresponding to structural groups within the molecule. The molecular moieties likely to absorb light in the 200 to 800 nm regions are pi- electron functions and hetero atoms having non-bonding valence-shell electron pairs. Such light absorbing groups are referred to as chromophores (Fig. 13.19).

The Beer-Lambert law (also called the Beer-Lambert-Bouguer law or simply Beer’s law) is the linear relationship between absorbance and concentration of an absorber of electromagnetic radiation. The general Beer-Lambert law is usually written as: A= aλbc, where A is the measured absorbance, ax is the wavelength-dependent absorptivity coefficient, b is the path length, and c is the analyte concentration.
When working in concentration units of molarity, the Beer-Lambert law is written as:
A= ԑλbc, where ԑλ is the wavelength-dependent molar absorptivity coefficient with units of M-1 cm-1. The λ subscript is often dropped with the understanding that a value for ԑ is for a specific wavelength. If multiple species that absorb light at a given wavelength are present in a sample, the total absorbance at that wavelength is the sum due to all absorbers.
In analytical applications we often want to measure the concentration of an analyte independent of the effects of reflection, solvent absorption, or other interferences. The figure below shows the two transmittance measurements that are necessary to use absorption to determine the concentration of an analyte in solution. In this example, Is is the source light intensity that is incident on a sample, I is the measured light power after passing through the analyte, solvent, and sample holder, and Io is the measured light power after passing through only the solvent and sample holder. The measured transmittance in this case is attributed to only the analyte (Fig. 13.20).

If the compound in a sample does not absorb light at a given wavelength then, I = I0. However, if the compound absorbs light then I is less than I0, and this difference may be plotted on a graph versus wavelength, as shown on the right. Absorption may be presented as transmittance (T = I/I0) or absorbance (A= log I0/I). If no absorption occurs then, T = 1.0 and A= 0. Most spectrometers display absorbance on the vertical axis, and the commonly observed range is from 0 (100% transmittance) to 2 (1% transmittance). The wavelength of maximum absorbance is a characteristic value, designated as λmax.
Essay # 2. Types of Spectroscopy:
A. UV-Visible Spectroscopy:
In UV/Visible Spectroscopy, the term chromophore is used to indicate a functional group that absorbs electromagnetic radiation, usually in the UV or visible region. The type of functional groups that absorb ultraviolet light can be conjugated species, such as alkenes, aromatics, etc. Also many metal-ligand complexes also absorb UV/visible light. It is important to remember that UV/visible EM radiation causes electronic transitions within a molecule, promoting bonding and non-bonding electrons to higher, less stable antibonding orbitals. The molecule then loses this excess energy by rotation and vibrational relaxation, but some compounds can lose their energy by emission processes such as fluorescence.
Working of UV-Visible Spectroscopy:
UV-VIS spectrometers consist of a light source, reference and sample beams, a monochro- mator and a detector. The ultraviolet spectrum for a compound is obtained by exposing a sample of the compound to ultraviolet light from a light source, such as a Xenon lamp. The reference beam in the spectrometer travels from the light source to the detector without interacting with the sample. The sample beam interacts with the sample exposing it to ultraviolet light of continuously changing wavelength. When the emitted wavelength corresponds to the energy level which promotes an electron to a higher molecular orbital, energy is absorbed.
The detector records the ratio between reference and sample beam intensities (Io/I). At the wavelength where the sample absorbs a large amount of light, the detector receives a very weak sample beam. Once intensity data has been collected by the spectrometer, it is sent to the computer as a ratio of reference beam and sample beam intensities. The computer determines at what wavelength the sample absorbed a large amount of ultraviolet light by scanning for the largest gap between the two beams.
When a large gap between intensities is found, where the sample beam intensity is significantly weaker than the reference beam, the computer plots this wavelength as having the highest ultraviolet light absorbance. Over a short period of time, the spectrometer automatically scans all the component wavelengths in the manner described. The ultraviolet (UV) region scanned is normally from 200 to 400 nm, and the visible portion is from 400 to 800 nm (Fig. 13.21).

Different compounds may have very different absorption maxima and absorbances. Intensely absorbing compounds must be examined in dilute solution, so that significant light energy is received by the detector, and this requires the use of completely transparent (non- absorbing) solvents. The most commonly used solvents are water, ethanol, hexane and cyclohexane.
Proteins have an absorption maxima at 280 nm, which can be used for the quantification. Trypophan, tyrosine, histidine, and phenylalanine residues contain aromatic rings that absorb the greatest amount of light at 280nm. Nucleic acids have an absorption maximum close to 260 nm. At a wavelength of 260 nm, the average extinction coefficient for double-stranded DNA is 0.020 (μg/ml)-1 cm-1, for single-stranded DNA and RNA it is 0.027 (μg/ml)-1 cm-1 and for short single-stranded oligonucleotides it is dependent on the length and base composition. Thus, an optical density of 1 corresponds to a concentration of 50 μg/ml for double- stranded DNA.
B. Infrared Spectroscopy:
IR Spectroscopy:
Infrared, or IR spectroscopy a type of vibrational spectroscopy, is a spectroscopic technique where molecular vibrations are analyzed. Molecules are formed by combining atoms together by chemical bonds. To make this clear, imagine two spheres, or masses, connected with a spring. This is what is known as a simple harmonic oscillator.
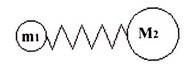
Once set into motion, the sphere will oscillate, or vibrate back and forth on the spring, at a certain frequency depending on the masses of the spheres and the stiffness of the spring. A sphere with a small mass is lighter and easier to move around than one with a large mass. Therefore, smaller masses oscillate at a higher frequency than larger masses. A very stiff spring, like a bedspring, is hard to deform and quickly returns to its original shape when the deforming force is removed. The bond is the spring, and the two atoms, or groups of atoms, connected by the bond are the masses. Every atom has a different mass, and single, double and triple all have different stiffness, and therefore each combination of atoms and bonds has its own characteristic harmonic frequency.
At any temperature above absolute zero, all the little simple harmonic oscillators that make up any molecule are vibrating vigorously. Infrared light just happens to be in the same frequency range as a vibrating molecule. So, if you hit a vibrating molecule with some IR light, it will absorb those frequencies in the light which exactly match the frequencies of the different harmonic oscillators that make up that molecule.
When this light is absorbed, the little oscillators in the molecule will continue to vibrate at the same frequency, but since they have absorbed the energy of the light, they will have larger amplitude of vibration. This means that the “springs” will stretch further than before the light was absorbed. The remaining light which was not absorbed by any of the oscillators in the molecule is transmitted through the sample to a detector, and a computer will analyze the transmitted light and determine what frequencies were absorbed.
Many vibrational motions of molecules are motions that involve the entire molecule. Analysis of such motions can be very difficult if we are dealing with substances of unknown structure. Fortunately, the infrared spectrum can be divided into two regions, one called the functional group region and the other the fingerprint region. The functional group region is generally considered to range from 4000 to approximately 1500 cm-1 and all frequencies below 1500 cm-1 are considered characteristic of the fingerprint region.
The fingerprint region involves molecular vibrations, usually bending motions that are characteristic of the entire molecule or large fragments of the molecule. Used together, both regions are very useful for confirming the identity of a chemical substance. This is generally accomplished by a comparison of the spectrum of an authentic sample. The functional group region tends to include motions, generally stretching vibrations, that are more localized and characteristic of the typical functional groups found in organic molecules.
While these bands are not very useful in confirming identity, they do provide some very useful information about the nature of the components that make up the molecule. Perhaps most importantly, the frequencies of these bands are reliable and their presence or absence can be used confidently by both the novice and expert interpreter of infrared spectra. IR is used to gather information about compound’s structure, assess its purity, and sometimes to identify it (Table 13.4). An IR spectrum is a plot of wave number (X-axis) vs. percent transmittance (Y-axis).
")
Infrared spectra may be obtained from samples in all phases (liquid, solid and gaseous). Liquids are usually examined as a thin film sandwiched between two polished salt plates (note that glass absorbs infrared radiation, whereas NaCl is transparent). If solvents are used to dissolve solids, care must be taken to avoid obscuring important spectral regions by solvent absorption. Perchlorinated solvents such as carbon tetrachloride, chloroform and tetra- chloroethene are commonly used. Alternatively, solids may be incorporated in a thin KBr disk, prepared under high pressure, or mixed with a little non-volatile liquid and ground to a paste (or mull) that is smeared between salt plates.
C. Nuclear Magnetic Resonance (NMR) Spectroscopy:
Nuclear Magnetic Resonance (NMR) is a non-destructive technique for mapping molecular structures and learning how molecules function and relate to each other. It relies on magnetic properties possessed by some nuclei, notably 1H, 13C, 19F and31 P. This is important for many applications, including the drug discovery, evaluation of new synthetic material and exploring realms of the proteomics.
NMR spectra arise from a characteristic property of the nucleus, called nuclear spin on its axis characterized by nuclear spin quantum number.
The spinning nucleus generates a magnetic field, since it is a moving charge. If an external magnetic field is applied to the nucleus, then the spin state where the nuclear magnetic field is aligned with the external field has a different, lower, energy from that spin state that gives rise to an opposing field. This action is called resonance and can be physically mapped, showing which atoms are present in the molecule and where they are located in relation to each other, thus the term nuclear magnetic resonance.

Since the two states have different energies, it is possible to convert a nucleus from the lower-energy state E1 to the higher state E2 by the input of suitable energy. The energy difference ∆E is such that radio frequency waves will perform this switch. The NMR spectrum arises because nuclei in different parts of the molecule experience different local magnetic fields according to the molecular structure, and so have different frequencies at which they absorb. This difference is called the chemical shift.
The radio frequency used depends on the strength of the magnetic field; early machines used magnetic field strengths of around 1.5 Tesla (15000 Gauss), the proton magnetic resonances being around 60MHz. In practice the radio frequency is kept constant, and the magnetic field is then swept over a narrow range of field strength. The absorptions are plotted on a graph where the frequency differences (in reality magnetic field differences) are plotted relative to some standard compound which defines the zero; for proton magnetic resonance this compound is TMS, tetramethylsilane, Si (CH3)4 (Fig. 13.22).
Each molecule has a different internal structure, depending upon the atoms it contains, and these varying structures paint a unique profile, or spectrum, when exposed to magnetic energy. Not only does this technology allow researchers to understand the three dimensional structure and relationships of atoms in molecules, but it also tells them how they relate to other atoms in the molecule over time. This characteristic is important in the study of proteins, carbohydrates, and genetic material, such as DNA and RNA.
Working:
The basic arrangement of an NMR spectrometer is shown above. The sample is positioned in the magnetic field and excited via pulsations in the radio frequency input circuit. The test sample is put in a long slender glass tube with 1″ of liquid. Samples can be less than 1/1000 cubic inch of the gas, liquid, or solid. The realigned magnetic fields induce a radio signal in the output circuit which is used to generate the output signal (Fig. 13.23).

The NMR console triggers split-second bursts, or pulses, of RF energy that are precisely sequenced to excite the sample in the probe and cause the atomic nuclei to resonate. The high-power RF energy pulses are sent to the NMR probe, the “antenna” that provides the radio frequency (RF) link between the sample and the instrument. The superconducting magnet provides a strong, homogenous magnetic field that can be as much as 200,000 times stronger than the earth’s magnetic field.
The natural magnets in the nuclei line up with the powerful NMR magnet, similar to iron fillings aligning with the magnetic field of a toy magnet. The RF pulses from the NMR console excite the atoms in the sample, making the nuclei “wobble” or resonate. As soon as the RF signals stop, the nuclei return to their natural and more comfortable state.
As the nuclei relax, the NMR probe receives a very weak RF resonance response back from the sample and transmits it to the NMR console for amplification. The NMR console amplifies the faint returning signals over 1,000,000 times before sending them to the computer workstation for analysis. Fourier analysis of the complex output produces the actual spectrum. The pulse is repeated as many times as necessary to allow the signals to be identified from the background noise.
D. Mass Spectroscopy:
Mass spectroscopy helps to find out the molecular mass of an organic compound, which helps in the identification of an unknown compound like a metabolite. The physics behind mass spectrometry is that a charged particle passing through a magnetic field is deflected along a circular path on a radius that is proportional to the mass to charge ratio, m/e. In an electron impact mass spectrometer, a high energy beam of electrons is used to displace an electron from the organic molecule to form a radical cation known as the molecular ion.
The collection of ions is then focused into a beam and accelerated into the magnetic field and deflected along circular paths according to the masses of the ions. By adjusting the magnetic field, the ions can be focused on the detector and recorded. As ions are very reactive and short-lived, their formation and manipulation must be conducted in a vacuum. The pressure under which ions may be handled is roughly 10-5 to 10-8 torr (less than a billionth of an atmosphere).
Working of Mass Spectroscope:
The first stage is ionization, where a sample of atoms is injected into the vacuum chamber. An electron gun bombards the sample with electrons knocking some from the atoms, creating cations. When a high energy electron collides with a molecule it often ionizes it by knocking away one of the molecular electrons (either bonding or non-bonding). If molecules are used they may be broken into fragments. (For example an atom M under goes the change M(g)—>M+(g) + e‑).
The next stage is acceleration. Negatively charged plates produce an electric field that accelerates the ions towards the electromagnet. Defection takes place next, whereby a magnetic field deflects the ions. The extent of the deflection depends on the mass of the ions. When the ion beam experiences a strong magnetic field perpendicular to its direction of motion, the ions are deflected in an arc whose radius is inversely proportional to the mass of the ion. Lighter ions are deflected more than heavier ions.
By varying the strength of the magnetic field, ions of different mass can be focused progressively on a detector fixed at the end of a curved tube (under a high vacuum). A tiny current is produced when the cation reaches the detector. A recorder counts the number of signals and represents it as peaks on mass spectrum graph. Since mass spectrometer separates and detects ions of different masses, it easily distinguishes different isotopes of given element (Fig. 13.24).
