
Here is a compilation of essays on ‘Poverty in India’ for class 8, 9, 10, 11 and 12. Find paragraphs, long and short essays on ‘Poverty in India’ especially written for school and college students.
Essay on Poverty in India
Essay Contents:
- Essay on Poverty in India
- Essay on the Causes behind Mass Poverty
- Essay on the Measurement of Poverty in India
- Essay on the Measures Adopted for Eradication of Poverty
- Essay on the Concluding Observations on Poverty in India
- Essay on WTO and Agriculture of Developing Countries
Essay # 1. Poverty in India:
The worst enemy of civilisation, society and environment is poverty. Wealth is the blanket we wear and poverty is to have that blanket taken away. Poverty means that opportunities and choices most basic to human development are denied and, hence, it means hunger, malnutrition, deprivation, discrimination, etc. It is primarily the task of the government of any country to eradicate poverty. In fact, human deprivation, inequality and poverty are interrelated in the society.
The measures of economic development and social sector reforms adopted in the less developed countries like India are expected to eradicate poverty and also to reduce economic inequalities and human deprivation. However, one cannot expect complete elimination of inequalities and human deprivation in a country. But it is quite reasonable to expect complete elimination of poverty.
However, it is difficult to identify a ‘poor’ person in absolute terms as the identification of a poor as well as the definition of a national poverty line varies among countries. A person being identified as a ‘poor’ in developed country may not necessarily be identified as a ‘poor’ in a less developed country. Generally, we identify a person to be poor if his income is too low to enable him to maintain at least a subsistence level of living, i.e., to attain a minimum calorie intake of food.
In a wider sense, a person unable to meet the basic needs of nutrition, clothing, shelter, education, etc. is identified as a ‘poor’. In a relative sense, however, the nature and magnitude of poverty always vary among countries.
The different approaches towards measurement of poverty all indicate different estimates of poverty within the same country, say, within India. The World Bank has introduced a measure of ‘absolute poverty’ through the introduction of ‘international poverty line’.
The problem of poverty in India is acute and its magnitude is reducing at a very slow rate. It is, therefore, necessary to examine its causes and magnitude as revealed from different estimates along with a review of measures adopted for its eradication in India during the Plan Period (1951 to date).
Essay # 2. Causes behind Mass Poverty:
The different causes behind the occurrence of mass poverty in India may be classified as:
(i) Economic,
(ii) Social,
(iii) Historical; and
(iv) Political.
These causes are separately analysed, in brief:
(i) Economic Causes:
The economic causes may be mentioned, in brief, as:
(1) Faulty Strategy of Planning:
Indian planners had always believed that growth of the economy would eradicate poverty The Draft of the Fifth Five Year Plan stated that a higher rate of growth of national income would itself enlarge employment opportunities and hence improve the standard of living of poor masses.
The planners relied on the ‘trickle-down mechanism’ of reducing poverty This mechanism implies that rapid growth of per capita income is associated with reduction in poverty, i.e., rapid economic growth would trickle down lower income groups and thus poverty would be eradicated. But this expected mechanism did not work in India.
The fruits of growth have all been consumed by the rich and upper income groups. The adoption of capital intensive technology and assignment of priority on the development of heavy and basic industries in the second Five Year Plan also marked the adoption of an inappropriate strategy of development planning in the labour surplus economy of India.
The strategy for agricultural development in India also favoured the rural rich in many ways. The inadequate progress of land reforms occurred mainly due to the apathy of ruling political parties in all the states, barring a few states and it was reflected through a large number of loopholes in the land ceiling legislations.
The Indian bureaucracy has always been found to be apathetic towards implementation of measures of land reforms as well as eradication of poverty as it consisted mainly of the people from rich and higher middle class sections. The planners always preferred technological reforms to institutional reforms in Indian agriculture.
The strategy of green revolution intensified inequality between rich and poor farmers. This new technology with high cost of investment favoured rich farmers and discriminated against poor farmers. Moreover, there occurred misdirection of government’s expenditure towards benefit of rich farmers who enjoyed huge subsidies in the ways of securing different forms of fixed and circulating capital inputs.
The surpluses generated from modern farming by rich farmers did not contribute adequately to capital formation and growth of non-farm sectors. Instead, these were directed to various forms of conspicuous consumption.
Lord Megnad Desai correctly remarks that “India’s poverty creation programme is larger than its poverty-removal programme”. P. Streeten and M. Lipton analysed the crisis of Indian planning and pointed out that one major reason for inadequate development of the rural sector had been the ‘urban bias’ while planning for rural development in India While planning for development, two questions are always raised.
What should be the way of development and for whom there would be the development? The choice of capital intensive technology in a labour surplus economy of India has created a low employment elasticity of growth.
The Report of the IAMR (2004) may be mentioned with respect to a few selected sectors of the economy in Table 1:

The figures of low employment elasticity of growth (1980-2000) as observed in Table 32.1 clearly show the nature of ‘jobless growth’ that occurred in India. The mining and quarrying sector displayed negative employment elasticity while the agricultural sector had almost zero employment elasticity because there was practically no growth of employment in this sector during this period.
The average annual employment elasticity of growth in the entire economy has reduced by almost 50 per cent, i.e., from 0.41 during the period 1980-81 to 1990-91 to 0.23 during the period 1992-93 to 1999-2000. It may be considered as an immediate impact of economic reform in India.
Such a trend of low employment elasticity of growth clearly reveals why poverty persists in the country. A study by World Bank titled, “India: Reducing Poverty, Accelerating Development” (2000) shows the average annual percentage rates of reduction of poverty in the states of India during the period 1978-1994.
The two leading states in this context are West Bengal (4.2 per cent) and Kerala (3.7 percent) while all other states miserably lagged behind. The report remarks “… in Kerala, human resource development enabled Keratites to emigrate internationally and generate remittances that raised income and reduced poverty … In the case of West Bengal, land reforms and high agricultural growth over the period may have been important causal factors”
It is worth mentioning that land reforms succeeded remarkably only in the two states of Kerala and West Bengal. To quote another study of World Bank titled, “India—Achievements and Challenges in Reducing Poverty ” (1997): “Moderate land reforms in Kerala and West Bengal have helped to diffuse economic and political concentration and provided a more adequate basis for promoting participation, improving the prospects for labour and accelerating poverty reduction. But ambitious programmes of tenancy reform and implementation of land ceilings have been largely unsuccessful in most states.” So, it is clear that faulty planning strategies neglecting the application of labour intensive technologies, land reforms, etc. have been largely responsible for persistence of poverty in India.
(2) Population Explosion:
The abnormally high rate of growth of population in India has caused all types of adverse effects upon the economic development of the country. Figures in Table ‘2’ show such high growth rates.

The problems of low productivity, low per capita income, low average household income food shortage, low average standard of living, widespread exclusion of households from the access to basic amenities of life, inflation, unemployment, human deprivation and poverty high incidence of rural indebtedness, continuous process of sub-division and fragmentation of land holdings causing rapid growth of uneconomic landholdings, ever-increasing number of landless agricultural labourers, etc. factors are outcomes of population explosion in India and these together have simply intensified the problem of mass poverty in India.
While discussing “Conditions for Economic Progress”, Colin Clark suggested that investment should increase by four times the increase in population. So, considering the figure of 2 13 per cent average annual rate of growth of population in India (1991-2001 period), 8.52 percent of national income should be invested in India which seems to be very difficult.
But unless it is done, it will be impossible to get rid of the traps of overpopulation and mass poverty in India. The combined effects of growing relative poverty and overpopulation have caused mounting absolute poverty in India.
(3) Economic Inequalities:
An important factor behind the occurrence of poverty is inequality in the distribution of income and wealth in India. Though such inequalities are also observed in developed countries yet the level of average household income is at a much higher level in such countries compared to the same in less developed countries like India. Figures in Table 3 show the inequitable distribution of landholdings in India.

Figures in Table ‘3’ show that the percentage figure of poor farmers account for 81.97 and that of rich farmers is 18.03. So, Indian agriculture is dominated by the class of poor farmers. A different study conducted by the National Sample Survey Organisation reports that only 12 per cent of farmers owns 58 per cent of landholdings in India.
The monopoly concentration of Indian industries was also reported by Mahalanobis Committee, Hazan Committee and the Monopoly Enquiry Commission. The ‘World Development Report (2006) of the World Bank shows that the Gini Index of Inequality in income was measured at 0.33 in India in 1999-2000. So, high degree of economic inequality and mass poverty coexist in India.
(4) Problems of Unemployment and Underemployment:
The typical underdeveloped economic structure characterised by the occurrence of the vicious circle of poverty as well as by that of the problem of population explosion has caused prevalence of almost all types of unemployment and underemployment in India. The chronic problem of unemployment has also been responsible for the prevalence of mass poverty in India.
The NSSO carried out its different rounds of survey on the unemployment rates in India. The 50th and 60th rounds of such surveys of the NSSO conducted in 1993-94 and 2004, respectively, have reported such unemployment rates as 2.62 and 3.06 percentages of the labour force respectively.
(5) Industrial Sickness and Retrogression:
Since the mid-1960s, a large number of traditional manufacturing industries of India have been suffering from the problems of sickness and retrogression due to a variety of factors such as introduction of better substitutes, lack of modernisation, inefficient management, demand recession, labour unrest, shortage of working capital, power crisis, and different other forms of inadequate facilities of infrastructure, faulty policies of the government, uneven competition from multinational corporations, high burden of overhead costs, failure of public sector enterprises, etc.
The total number of sick industrial units (i e small, medium and large industrial units) was measured at 2, 37, 400. Naturally, at different stages, several lakhs of workers lost their jobs and a considerable section of them was pushed below the poverty line. Many of them were thus compelled to engage themselves in different low-income earning activities in different occupations under the unorganised sector of the economy.
(6) Regressive Tax Structure:
The potentiality of collection of tax revenue is high if such taxes are imposed on production and sale of highly necessary consumer goods whose demand is inelastic. The poor people spend either entire or major part of their income on such goods. The indirect taxes are regressive as these impose a higher real burden of tax on the poor.
In India, the share of indirect tax within the total collection of taxes increased from 57 per cent in 1950-51 to 62 per cent in 2003-04. So this regressive structure of taxation has intensified the problem of poverty in India.
Furthermore, different loopholes and inadequacies in direct tax legislations have encouraged widespread tax evasion and accumulation of black money in the country. This has raised the rate of inflation while also increasing income inequalities and the poor have become poorer.
(7) Inflation:
India has also suffered from the problem of inflation during the entire Plan Period (1951 to date) on account of the factors like low productivity, over-population, growing volume of deficit financing, oil price hike, dishonest trading activities, monopoly concentration, etc. Indian Plans consistently failed to achieve the objectives of growth with stability, equity, social justice, etc.
Inflation has caused reduction of real wages of the working class. The worst victims had been the agricultural labourers whose real wages had been below the minimum required level of subsistence real wage. So, these agricultural labourers are all recorded as living below the poverty line.
(8) Privatisation of Common Property Resources:
In his research work titled “Indian Agriculture and the Multilateral Trading System” (2001), Brajesh Jha points out that there has occurred increasing privatisation of common property resources that caused widespread marginalization of the poor people who depended on the same.
(9) Ecological Degradation:
The UNDP declared that poverty appeared as the greatest enemy to environment. Widespread deforestation for collection of fuel wood by the poor people coupled with hunting of animals for meat have caused deforestation and ecological degradation and, thus, persistence of poverty caused several cumulative adverse effects on ecology.
(10) Regional Variations:
Regional variations in the nature of physical environment and climate have also caused regional variation in the occurrence of poverty among states and also among districts in each state. So, poverty is found to be relatively more acute in drought-prone and hilly areas. Suresh Tendulkar has shown in his studies on incidence of poverty in India (1987-88) that there has occurred actually polarisation among the states—both in agricultural growth and in poverty incidence.
(ii) Social Causes:
The social factors are also responsible for the occurrence of mass poverty in India. The widespread existence of semi-feudal social and cultural institutions like religious dogmas, social discriminations arising out of casteism, religious fundamentalism, gender discriminations, fatalistic attitudes, conservatism, extravagant expenses on social and religious ceremonies, causing high level of chronic indebtedness of rural poor, prevalence of the systems of child labour and bonded labour, high incidence of illiteracy among rural and specially among female population in many states (specially in the overpopulated states like Bihar, Uttar Pradesh, Madhya Pradesh, Rajasthan and Orissa), etc. may be mentioned in this context.
(iii) Historical Causes:
The imperialist policies of the British during their colonial rule for a period of approximate two centuries caused huge drain of income and wealth from India as pointed out by Dadabhai Naoroji in “Poverty and Un-British Rule in India” and also by R. C. Dutt in “The Economic History of India”.
They pointed out how the surplus went out as unrequired exports, home charges etc. which drained the life-blood of India in a continuous ceaseless now. Moreover, the introduction of the system of feudal landlordism through Permanent Settlement and different other systems, the emergence of the Managing Agency System and the calculated process of de-industrialisation of India as characterised by the decline of handicrafts, etc. also intensified poverty and inequality at a large scale.
(iv) Political Causes:
In India the political power has mainly been shared by two classes—monopolists and big landlords. The bureaucrats also hailed mainly from the rich and upper middle class sections of the society. So, there had been political as well as administrative apathy and resistance towards elimination of poverty in India. These factors have been the major causes behind the failure in the implementation of programmes of both land reforms and poverty-eradication in India.
Essay # 3. Measurement of Poverty in India:
Some alternative measures of Poverty may be mentioned in brief:
(1) Poverty Ratio (i.e., Head Count Ratio):
A national poverty line is determined following the biological approach towards the measurement of poverty. It is determined on the basis of the money value of the minimum required consumption requirements food and non-food items. The persons unable to acquire it are called the people living below the national poverty line.
The World Bank has two such different international measures of poverty line, such as, the two separate figures of percentages of population failing to spend (i) one US dollar P.P.P (i.e., Purchasing Power Parity) per day and (ii) two US dollars P.P.P. per day. Obviously, the first measure is appropriate for the less developed countries and the second one is that for the developed countries.
This measure is known as the measure of ‘Poverty Ratio’. It is also called the ‘Head Count Ratio’ ‘Head Count Index’. In India, it is considered for measurement of poverty. A strictly nutritional measure is made by considering two separate poverty lines for rural and urban people and an average of the two is also calculated.
The Planning Commission has determined the minimum daily requirement of calorie-intake of food separately for an adult person at 2,400 calories, 2,100 calories and 2,250 calories for rural population, urban population and an average of the two, respectively.
This measure is expressed as:
H = Q/n
where Q = Number of persons with consumption expenditure less than the poverty,
n = Total number of persons, and
H = The Poverty Ratio or Head Count Ratio (or, Index)
So, by converting the figure of H in percentage (i.e., H = Q/nx 100), we can get the percent age figure of Poverty Ratio, i.e., of Head Count Ratio.
For about last four decades (1968-2007), a large number of estimates of poverty have been conducted in India following this measure. Some of those may be separately mentioned in brief:
P. D. Ojha (1967-68) considered the estimate for the year 1967-68 on the basis of 1960-61 prices He observed that 51.8, 76 and 44 percentages of rural, urban and total population of India lived below the poverty line.
Considering the same 1960-61 price level, V. M. Dandekar and Nilkantha Rath estimated the poverty line for the year 1968-69. According to them, 40 percent of rural and 50 per cent of urban population lived below the poverty line.
Later on, P. D. Ojha conducted a revised estimate and mentioned that compared to 1960-61 the nutritional deficiency widened considerably in rural areas in 1967-68 when the figure of rural poverty ratio increased to 70 per cent.
Considering the N.S.S. (National Sample Survey) data of consumption expenditures B S Minhas estimated two separate percentage figures of total population living below the poverty me in India, such as, 65 per cent in 1956-57 and 50.6 per cent in 1967-68. So, Minhas claimed that the poverty ratio decreased during this period.
Pranab Kumar Bardhan had a different estimate of rural poverty and he concluded that the rural poverty ratio increased from 38 per cent in 1960-61 to 54 per cent in 1968-69
Montek Singh Ahluwalia estimated that the rural poverty ratio was at 65 per cent in 1956-57 and it gradually fell to 56.4 per cent in 1961-62, but again slightly increased to 57 8 per cent in 1963-64, but thereafter it fell continuously to 50.5 per cent in 1967-68
However, later on B. S. Minhas along with L. R. Jain and S. D. Tendulkar conducted appropriate price adjustments in their study and estimated that rural, urban and total poverty ratio figures were at 44.8, 36.5 and 42.7 percentages, respectively.
V. M. Dandekar also made new estimates of rural poverty ratio based on the prices prevailing in 1971-72, 1977-78 and 1983-84 and with respect to these years, the figures of rural poverty ratio were estimated at 46, 49.5 and 44.4 percentages, respectively.
The estimates of Planning Commission show that rural poverty ratio decreased from 53 per cent in 1970-71 to 30.6 percent in 1996-97, the urban poverty ratio decreased from 51 percent in 1970-71 to 25.6 per cent in 1996-97 and the total poverty ratio decreased from 52 per cent in 1970-71 to 29.2 per cent in 1996-97.
The World Bank, through its Expert Group, conducted different estimates of poverty in India. These were based on both national and international poverty lines as determined by it. The World Bank’s estimates, based on its national poverty line for India (World Development Indicators, 2004, World Bank) show that the rural, urban and total poverty ratios reduced from 44.9, 36.4 and 42.5 percentages, respectively, in 1983 to 30.2, 24.7 and 28.6, respectively, in 1999-2000.
Following the international poverty line of failing to spend one U.S. dollar P.P.P per day, the World Bank has estimated the total poverty ratio in India at 35.3 per cent in 1999- 2000. But the UND P, in its Human Development Report, 2006 mentions that this poverty ratio, based on the international poverty line, is estimated at 34.7 per cent in 2004.
It is expected that the under pourished population must always be below the poverty line. But with respect to such figures estimated by the F.A.O and published in the ‘Human Development Report’, 2006 of the UNDP and also by the World Bank, in its report ‘Ataining the Millennium Development Goals in India’, prepared by A. B. Deolalikar, a controversy can quite reasonably emerge.
The percentage figure of calorie-deficient undernourished people in India is estimated at 20 per cent in 2003 by the UNDP and at 52.3 by the World Bank. So, the World Bank’s figure of poverty ratio and these figures of calorie- deficient undernourished people are quite inconsistent. The World Bank’s study of calorie- deficiency has been based on the 55th round survey of the N.S.S. in 1999-2000.
The N.S.S. estimated the rural, urban and total poverty ratios on the basis of its 55th round survey of 1999-2000 at the figures of 27.1, 23.6 and 26.1 percentages, respectively. The 61st round survey of the N.S.S. in 2004-05 estimated the figures of rural, urban and total poverty ratios at 29.18, 26.02 and 28.27 percentages, respectively. The methodology of the study did not change and, hence, a slight rise in all forms of poverty ratio is observed during the period of five years between 1999-2000 to 2004-05.
All these different estimates of poverty had variations on account of differences in their methodologies, sample sizes, consideration of different price levels that prevailed in different years, etc. While considering the similar minimum required nutritional standards for estimating rural, urban and total poverty ratios at 2,400 calories, 2,100 calories and 2,250 calories, respectively, the minimum required levels of consumption expenditures or incomes were considered differently in different studies.
It is also worth mentioning that all sample surveys have some limitations of reporting perfectly true information. The most suitable method is to consider separate price indices for rural and urban population, i.e., to use, he Consumer Price Index for Agricultural Labourers and the Consumer Price Index ‘or Industrial Workers for rural and urban population, respectively, for the purpose of updating the estimates of poverty. But these were not considered in all the studies though the Planning Commission and the N.S.S. accepted these in their methods.
It is observed from all these different studies that the entire section of agricultural labourers, the major section of marginal farmers and a considerable section of the small farmers constitute the rural poor. The artisans in villages and the workers of the unorganised manufacturing and service sectors of both rural and urban areas are poor—being practically underemployed.
They earn abnormally low levels of income being employed in jobs with low productivity. The dwellers of pavements and slums constitute the urban poor—as either they do not have any regular source of employment or they are employed in abnormally low income-earning jobs in the unorganised sector.
The urban poor also constitutes that particular section of the rural poor who migrated from rural areas to urban areas in search of relatively higher income.
To quote B. S. Minhas:
“Judged by any reasonable standards, the extent of abject poverty in rural India is alarmingly massive. The precise estimate of whether it is two-fifth or one-half of rural people, who are beset with crushing poverty today, is a terribly academic matter. A far more important and practical need today is to focus policy analysis on concrete measures for the benefit of the poor, particularly the rural poor, who are more numerous but fail to catch as much attention as the urban poor”.
The Poverty Ratio or Head Count Index has not been found to be an acceptable measure of poverty by many economists for the following reasons:
Firstly, this measure is very simple and it fails to indicate the depth of poverty. The people living below the poverty line may be either very close to it or much further from it. In absolute terms, these two sections are same—being below the poverty line.
But, in reality, the depth of the poverty is different. In the 61st round survey of the N.S.S., the poverty ratios in Punjab and Orissa are found to be at 8.12 and 47.07 percentages, respectively. Naturally, there is a wide variation in the depth of poverty in these two states. Hence, the policies for eradication of poverty should be different in these two states.
Secondly, these measures ignore the nature of income inequalities among the poor and it also fails to assess the possible impact of policies of redistribution of income among the poor.
(2) Poverty Gap Ratio:
Let the minimum required income for subsistence, i.e., income at the poverty line, be Yp and the actual income of an individual be Y1. So, if Yi, > Yp, then the individual is not poor. But, if Yi < Yp, then the individual is poor. So, for an individual, the income gap, Yp – Yi, measures the shortfall of income of the individual from his income at poverty line. Now if, in a country, there are n number of individuals and if, of them, K number of individuals are poor, then the total poverty gap is given by the total income shortfall and it is expressed as
![]()
So the total poverty gap measures the total amount of income needed to elevate all individuals living below the poverty line at present to reach at least this particular line and, hence, it will cause elimination of poverty. So this measure is useful for the purpose of formulation of policies to eradicate poverty.
Let us further assume there are n number of persons in the society and they have a mean income Y where the income at poverty line is YP and the number of persons below the poverty line is K. The Poverty Gap Ratio is the ratio of the average income to elevate all the individuals living below the poverty line to the poverty line divided by the mean income of all individuals in the society.
So, the poverty gap ratio (PGR) is expressed as:
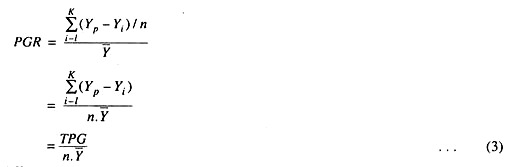
Two different measures of poverty gap ratio in India may be mentioned in this context. The estimate of Gaurav Dutta, based on this measure, shows that the rural poverty gap ratio in India increased from 17.175 during the pre-reform period of 1973-1991 to 8.205 during the post- reform period of 1991-1997. During the same period, the urban poverty decreased from 13.602 to 7.273—Gaurav Datta, Poverty Declined since Economic Reforms, EPW, December (17, 1999.)
The World Bank has measured the poverty gap ratios at two different international poverty lines with daily incomes of U.S. $1 PPP and U.S. $2 PPP with respect to the year 1999-2000. These were estimated at 7.2 and 34.9, respectively.
(3) Measure of Squared Poverty Gap:
The Foster-Greer Thorbecke Index is called the Squared Poverty Index.
It is a poverty measure by combining:
(a) The Poverty Ratio, i.e. the Head Count Index,
(b) The Income Gap Ratio measuring the depth of poverty, and
(c) The coefficient of variation measuring inequality in the distribution of income of the poor.
Here, Poverty Ratio, i.e., the Head Count Index (HI) is measured as: HI = Q/n
The Income Gap Ratio (IGR) is measured as:
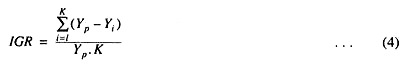
The coefficient of variation of income of the poor (CVp) has its usual statistical method of measurement.
The Squared Poverty Gap (SPG) is measured as:
SPG = HI [IGR2 + (1 – IGR)2. (CVp)2] … (5)
This measure is considered as the best measure of poverty as it has removed all the limitations in the earlier measures of poverty. Gaurav Dutt estimated the squared poverty gap index of India for both the rural and urban people with respect to the pre-Reform (1973-91) and the post Reform periods (1991-99).
The Squared Poverty Index of rural people decreased from 7.128 to 2.642 and that of urban people decreased from 5.219 to 2.474 during the period 1973-1999 (Gaurav Datt,’ Poverty Declined since Economic Reforms, EPW, December 11-17, 1999). This measure is additively decomposable and also fulfills the two axioms (montonically and transfer axioms) proposed by Amartya Sen for a poverty measure to satisfy.
This property of additive decomposability allows disaggregation of total poverty into poverty of sub-groups. Thus, considering the total poverty as a weighted average of sub-group poverty, it can quantify the effect of a change in sub-group poverty to total poverty or the sub-group contribution to total poverty.
(4) Social Measure of Poverty:
The Planning Commission conducted a very interesting study of poverty estimates in 1993- 94. It pointed out the incidence of poverty among different castes and religious groups in both rural and urban areas of India. It is mentioned in Table ‘32.4’. The figures in Table 32.4 show the magnitude of poverty in different social and religious groups. Excepting Sikhs and Jains, it is more or less severely observed among all other groups.
It is, however, alarmingly severe among Buddhists (55.34 per cent, 44.01 per cent), Muslims (41.27 per cent, 49, 23 per cent), Scheduled Castes (48.32 per cent, 49.84 per cent) and-Scheduled Tribes (51.96 per cent, 40.74 per cent). The figures in parentheses indicate percentage figures of poverty ratios in rural and urban areas respectively. In cases of Hindus, these figures are 37.50 and 30.31 respectively.

The figures in Table 4 show the magnitude of poverty in different social and religious groups. Excepting Sikhs and Jains, it is more or less severely observed among all other groups. It is, however, alarmingly severe among Buddhists, Muslims, Scheduled Castes and Scheduled Tribes.
(5) Measure of Human Poverty:
The UNDP has suggested the measure of Human Poverty Index for developing countries (HPI-1) and developed countries-(HP 1-2) separately.
So the appropriate measure for India is HPI-1 and its method of measurement is mentioned in the UNDP’s “Human Development Report, 2006” in the following way:
![]()
where P1 = Probability at birth of not surviving to the age of 40 years (per cent),
P2 = Adult illiteracy rate (per cent),
P3 = Un-weighted average (per cent) of population without sustainable access to an improved water source and children underweight for age,
and α = 3
Following this measure, the Human Poverty Index of India in the year 2004-05 has been measured at 31.3 per cent by the UNDP (Human Development Report, 2006). This type of measure has a completely different dimension as it shows that poverty is not merely a case of income-deprivation, it is also a case of human deprivation.
Essay # 4. Measures Adopted for Eradication of Poverty:
A careful review of different causes and estimates of poverty indicates the following facts:
(i) Poverty is relatively more acute among landless agricultural labourers, marginal farmers and small farmers as well as among t, it particular section of the urban population constituting those who migrated as rural poor to urban areas.
(ii) Though poverty arises principally due to a collection of economic factors, yet social conservatism, discrimination and backwardness are also responsible for it. It is for such a reason that poverty has become relatively more acute among Buddhists, Muslims, Scheduled Castes and Scheduled Tribes in India as these sections are relatively more disadvantaged due to many social factors.
(iii) The prolonged apathy among ruling political parties and bureaucrats hailing from rich and upper middle classes towards the poor is responsible for the slow pace of eradication as well as persistence of poverty in India.
However, the slogan of ‘Garibi Hatao’ on the eve of the Parliamentary election in 1971 was initiated by the then Prime Minister, Indira Gandhi, who was popularizing the idea of creating a Welfare State in India along with her thrust towards rural development, nationalisation of banks, etc.
Since then, a series of employment generating programmes was initiated since the Fourth Five Year Plan (1969-74) and specially during the Fifth Five Year Plan (1974-79) when priority was assigned on eradication of poverty, creation of additional employment opportunities and rural development.
It was felt by our planners that these measures would solve the problems of seasonal and disguised unemployment in India to a great extent and generate additional income of the rural poor—and thus alleviate the problem of rural poverty.
Some special programmes for socio-economic upliftment of the socially weaker sections and also of the urban poor were accordingly adopted. It was also felt that special programmes for development of the drought prone areas was necessary.
The programmes for eradication of poverty gradually increased in number since the decade of 1970s till now. These programmes are Minimum Needs Programme, Food for Work Programme, National Rural Employment Programme, Integrated Rural Development Programme, Jawahar Rozgar Yojana, Rural Landless Employment Guarantee Programme, Crash Scheme for Rural Employment, Training for Rural Youth for Self Employment, Employment Assurance Scheme, Prime Minister’s Integrated Urban Poverty Eradication, Self Employment Project for Urban Poor, Scheme for Self Employment for Educated Unemployed Youth, Swarnajayanti Gram Swarozgar Yojana, Sampoorna Gramin Rozgar Yojana, National Rural Employment Guarantee Scheme, National Food for Work Programme, Pradhan Mantri Gram Sadak Yojana, Integrated Watershed Development Programme, Swarna Jayanti Shahari Rozgar Yojana, National Rural Employment Guarantee Scheme, Targeted Public Distribution System of food-grains for below the poverty line (BPL) people, etc.
Besides, development agencies, such as SFDA and MFAL were set up to take special care for the development of small farmers, agricultural labourers and marginal farmers. Legislations were passed banning the practices of using bonded labour and child labour. The schemes like Indira Awe’s Yojana and Valmiki Ambedkar Awaas Yojana are meant for constructing small houses for the rural poor and urban slum-dwellers.
The typical regional developmental programmes for areas as well as the residents of environmentally disadvantaged areas are the schemes like Drought Prone Area Programme, Desert Development Programme, Integrated Watershed Development Programme, Hill Area Development Programme, Tribal Area Development Programme, etc. The Antyodaya Programme and Antyodaya Anna Yojana are meant for the ‘Dalit’ communities.
All other programmes are meant for the rural and urban poor as is clearly evident separately from the titles of these schemes. All these schemes aim at creation of additional employment and generation of additional income.
The specific schemes aimed for the rural poor are also directed towards different progammes such as construction of roads and bridges, irrigation canals, reclamation of moribund rivers and canals, development of drainage and flood control, creation and development of tanks and wells for irrigation, social forestry, etc. Following the principles of decentralised development, the rural Panchayats are implementing these schemes.
The labourers employed in such schemes receive daily wage during the period of such employment and such wages are mostly paid in cash and, in few cases, these are. also partly paid in kind in the form of food. Separate allocations of fund have been made for all these different schemes. Moreover, in the way of poverty alleviation, these schemes have helped the development of different types of infrastructure needed for future development of rural areas.
The latest drive towards this’ direction is the introduction of the National Rural Employment Guarantee Scheme. It is being implemented from February 2, 2006 in 200 identified districts with a view to providing 100 days of guaranteed unskilled wage employment to each rural household opting for it. Under this scheme, up to December, 2006, 53.65 crore person-days of employment were generated.
It is also worth mentioning that the government has introduced the system of identification of individuals living below the poverty line (BPL) and to distribute them food at much low and subsidized prices on the basis of such ‘BPL’ ration cards from fair price ration shops.
Inequality is also a major cause behind poverty and, hence, different State Governments implemented measures of land reforms though these were largely inadequate excepting in two States of West Bengal and Kerala.
So, large landholdings with capitalistic farming in Punjab, Haryana and western region of Uttar Pradesh continued to coexist with widespread feudal form of tenancy farming in all the States of India though in the states of West Bengal and Kerala, its scale is diminishing. Hence, measures adopted for reducing inequality in the distribution of agricultural landholdings practically failed.
Different other measures like Industrial Policies, Industrial Licensing Policies, Monopolies and Restrictive Trade Practices Act, etc. along with gradual expansion in the area of activities of the Public Sector were also drives towards restriction of growth of monopoly capital.
But the measures towards economic reforms rising on the wheels of privatisation, liberalisation and globalisation regenerated the growth of monopoly business, contraction of economic security and social safety nets of the common people and practically thwarted the drives towards reduction of economic inequalities and eradication of poverty in India.
The contraction of the activities of the Public Sector, a process of gradual withdrawal of the government from different areas of its intervention, continuous reduction in the expenditure of the government in cases of different developmental and employment generating schemes along with reduction in the payment of subsidies, etc. are parts of measures of economic reforms. Hence, quite naturally, such a process appeared as a severe hindrance towards eradication of poverty and inequalities in India.
Essay # 5. Concluding Observations on Poverty in India:
The root cause behind mass poverty in India lies in its typical underdeveloped economic structure characterised by the existence of economic dualism such as the coexistence of semi-feudal and semi-capitalistic socio-economic structure along with that of the vicious circle of poverty from both demand and supply sides. So, the measures for removal of poverty and inequality should be coupled together.
These will destroy the malaise in the economic structure—the skewed distribution of the ownership of income-yielding assets. The institutional maladies are needed to be rectified to eradicate poverty completely in the long run.
The programmes for poverty eradication neglected (i) the provisions for family welfare, social security, special care for the physically and socially handicapped, etc.; and (ii) the reality that regulations related to the use of forests have compelled tribals to refrain from their tradition of collection of many non-timber forest products required for meeting their needs for subsistence and cash.
It is also worth mentioning that instead of providing opportunities of self-employment, there should be emphasis on formation of ‘Self-Help Groups’ as it is difficult for poor individuals to have an access to the market and to face the challenge of competition.
The different programmes for rural development and generation of employment have actually created temporary scope of employment during a very small part of the year. It has also been alleged that rampant corruption over the use of such funds by the members of Panchayats and other powerful sections of the rural society as well as political and social discriminations related to the employment of the rural poor have occurred in different states.
There has also occurred corruption with respect to the identification of the poor and the issue of BPL ration cards among them for securing food at much low and subsidised prices. A study by Rajkrishna, Gumatse and others on behalf of the Planning Commission in Maharashtra and similar other studies in different regions of other states have confirmed this fact. The real thrust should have been given towards creation of some physical assets for the poor that would ensure a ‘sustainable improvement’ of their economic condition.
Pranab Bardhan, C. T. Kurien, Kamala Suri, S. Gangadharan, Gautam Mathur and others have pointed out the following causes behind failure of programmes for eradicator of poverty:
(i) Indian public economy has become an elaborate network of patronage and subsidies which have been enjoyed in reality by the rich and upper middle class;
(ii) A wide disparity in income is also observed within the working class itself, i.e., between the workers organised by trade unions in the organised sector and those having no such organisations in the unorganised sectors of the economy;
(iii) Misdirection in use of resources and human skills;
(iv) Total failure of the expectations from the ‘trickle-down hypothesis’ of development;
(v) Lack of political will and apathy of bureaucracy towards designing and implementing measures for eradication of poverty in Indian class-divided society dominated by feudal landlords and capitalists, etc.
However, to conclude, it may be said that the strategy of ‘economic development with a human face’ has failed in India. But we may still expect for adoption of such appropriate measures for eradicating poverty so that social justice which has been delayed should not be denied.
Essay # 6. WTO and Agriculture of Developing Countries:
The WTO agreement on agriculture provides a framework for the long-term reform of agricultural sector over the years to come with the objective of introducing increased market orientation in agricultural trade. It provides for commitment in the area of market access, domestic support and export competition.
The members have to transform their non-tariff barriers like quotas into equivalent tariff measures. (The tariffs resulting from this transformation, as well as other tariffs in agricultural products, are to be reduced on an average by 36% in the case of developed countries and 24% in the case of developing countries.
The reductions were required to be undertaken over a 6-year period in the case of developed countries and a 10-year period in the case of developing countries. The least developed countries were not required to make any commitment for reduction).
The main benefit that Less Developing Countries (LDCs) like India expects from the WTO provision relates to the improved prospects for agricultural exports as a result of likely increase in the world prices of agricultural products due to reduction in domestic subsidies and barriers to trade.
While on the one hand earnings from agricultural exports are likely to increase, on the other hand LDCs have been ensured that all major programmes for the development of agriculture will be exempted from the disciplines in the Agricultural Agreement.
Thus, the operation of the public distribution system will not be affected by the provisions of the Agreement; agricultural subsidies granted by LDCs need not be withdrawn till such time they remain within the prescribed limits specified in the agreement; and protection necessary for developing the agricultural sector in the LDCs might be continued. In fact, LDCs hope that the reduction of subsidies in the USA and the European community will enable them to increase their earnings from agricultural exports.
Critical Review:
There are a number of issues of concern to LDCs as far as the WTO Agreement on Agriculture (AOA) is concerned.
1. Discrimination:
AOA has legitimized the various trade distorting practices of the developed countries in their favour.
2. Unfair Advantage for DCs:
AOA provides that countries not using any subsidies during the period 1986-88 (which has been identified as the ‘base period’ for the Agreement) are prohibited from introducing any new subsidies in the WTO regime. This automatically places a small number of rich countries, which have been using export subsidies, in an advantageous position as they have been provided the opportunities to use these subsidies.
(It may be noted that while developed countries are allowed to retain 80% of their subsidies, the developing countries can subsidise their farmers not more than 10% of the total value of agricultural production).
3. Green Box and Blue Box Subsidies:
At present the subsidy which is given to peasant farmers in USA and EU is in the form of Green Box and Blue Box subsidies and are thus exempted from reduction commitments. Non-or minimal-trade distorting subsidies are called Green Box subsidies and less trade-distorting subsidies are treated as Blue Box subsidies.
Indian and other LDCs have objected to this and have argued that in the absence of specific discipline to ensure that farmers do not divert payment received for non-trade distorting objective to production boosting investment, all subsidies can distort trade.
4. Peak Tariff:
The maximum tariff on agricultural commodities in LDCs is very high. And the most important areas for LDCs fall under the highest tariff rates and include the major agricultural staple foods, cereals, meat, sugar, milk, butter and cheese as well as tobacco and cotton. Moreover, tariff wedges will continue to be significantly high on account of tariff escalation, which is a major factor preventing LDCs from diversifying and increasing their share of processed agricultural exports.
5. Food/Security:
Finally, an issue of specific concern to LDCs is food security. The AOA does not address itself adequately to this question and there is a line of thinking that views trade as providing the means for food security in these countries.
This assumes that the existence of global surpluses of food grains would enable the LDCs to meet their food needs through trade. According to this view. It is not necessary for LDCs to target food self-sufficiency as global surpluses would enable these countries to meet their food needs. This view is wrong.
Furthermore, this view is based on the belief that LDCs have sufficient foreign exchange at all times to meet their food import requirements. This again is not true. Accordingly, food self- sufficiency should remain the cornerstone of the food security system of the LDCs.
Comments:
An important question has been asked in the context of WTO provisions relating to agriculture. The question is do agricultural subsidies of DCs hurt the Third World? One of the major complaints of LDCs during the Doha Negotiations (2001) was the continuing existence of large agricultural export and production subsidies in rich countries. The US cotton subsidy, which depresses world cotton prices and, therefore, hurts cotton growers in West Africa, is the most commonly cited example.
On the other hand, China, which exports manufactured goods and imports food and other agricultural product is likely to be hurt by the removal of agricultural subsidies.
“However, in Paul Krungman’s view, LDCs may actually benefits from rich country export subsidies. As he put it, “Some third world farmers are hurt by low prices of subsidised food exports from Europe and the USA-but urban residents in the third world benefits, and so do farmers producing goods, such as coffee, that don’t compete with the subsidised products.”
As far as the effects of the Doha Round (2001) on low-income African countries is concerned, it appears that such countries would actually be made worse off, because the negative effects of higher food prices would more than offset the gains from higher prices for crops such as cotton.