
After reading this article you will learn about Break-Even Analysis:- 1. Meaning of Break-Even Analysis 2. Assumptions in Break-Even Analysis 3. Important Terms and Definitions 4. Applications 5. Advantages 6. Limitations.
Contents:
- Essay on the Meaning of Break-Even Analysis
- Essay on the Assumptions in Break-Even Analysis
- Essay on the Important Terms and Definitions used in Break-Even Analysis
- Essay on the Applications of Break-Even Analysis
- Essay on the Advantages of Break-Even Analysis
- Essay on the Limitations of Break-Even Analysis
Essay # 1. Meaning of Break-Even Analysis:
“Break-even point means the level of output or sales or the production capacity at which no profit or loss is achieved or at which operations pass from profits to losses or vice versa. In other words a business is said to break-even when its revenue/incomes equal its expenditure. When the production/sales exceed the break-even point there is profit or vice- versa.”
Break even analysis is of considerable help in engineering design and profit analysis. The break-even point means the level of output or sales at which there is no profit or loss. Thus an organization or business is said to break-even when its revenue equals its total cost.
Break even analysis is mainly concerned with finding out that point i.e. level of sales or output at which no profit or loss is made. The break-even analysis can be carried out algebraically or graphically.
The basic objective of any organization is to earn profit. Profit mainly depends upon production cost, production output and revenue. These three factors depend upon the level of various activities performed in the business. So proper planning and control of various operations is required to optimize profits.
Mathematically,
Profit = Total Revenue – Total Production Cost,
Where Total Revenue = No. of units produced x unit price.
Total cost = Unit cost x total units produced.
Again the unit price is dependent upon number of controllable and uncontrollable factors depending upon market conditions.
Cost per unit = Fixed cost (cost of infrastructural facilities) + variable cost (cost of input materials) Fixed costs are independent of production level but would decrease per unit output with increase in production output. Variable costs are directly related with level of production output.
So in order to optimize profit, there is need to analyse various costs and revenues at different levels of output. One simple method of increasing profits without any change in revenue is reduction in cost of production.
Cost of production can be minimized by:
(i) Increase in production output.
(ii) Waste reduction or reduction in number of rejections by applying proper quality control.
(iii) Changes in product design to introduce cheaper materials substitution.
(iv) Maintaining optimum inventory levels.
(v) Following standardization and simplification in product and input materials.
(vi) Imparting proper training to man power and introducing incentive schemes.
(vii) Improving efficiency of the system.
Essay # 2. Assumptions in Break-Even Analysis:
The various assumptions which are taken into consideration before drawing the break-even charts are as
(1) All costs related with production and distribution of the product can be divided into two categories viz., fixed costs and variable costs and it is assumed that:
(i) All fixed costs are absolutely fixed over the entire range of volume of production.
(ii) All variable costs are absolutely variable over the entire range of volume of production. Thus there is linear relation between total cost and output.
(2) It IS assumed that all revenue is perfectly variable with the physical volume of production.
(3) The prices of input factors e.g. raw materials, finished components/parts and labour etc. are assumed to be constant.
(4) It is assumed that cost is related to level of output only i.e. the efficiency of men and machines remain constant.
(5) Production and sales are synchronized i.e. volume of production and volume of sales are equal.
(6) In case of multi-product firms, the product mix should be stable.
Essay # 3. Important Terms and Definitions used in Break-Even Analysis:
(i) Break-Even Point:
In the words of C.T. Horngren, “The break-even point is that point of activity (sales volume) where total revenues and total expenses are equal. It is the point of zero profit.”
Thus Break-Even Point (B.E.P.) indicates a level of output where the total costs (fixed costs plus variable costs) are just equal to break-even with sales amount and thus it is a point of no profit and no loss. We may term it as a point beyond which there are no losses but only profits. A business will have profit only when its sales volume is more than breakeven point.
(ii) Break-Even Chart:
As shown in Fig. 11.1 it is a graph indicating the variation in costs at different levels of output (cost lines) as well as variation levels of output (Revenue lines).

Break even chart is an aid to the management in decision making by graphically representing sales revenue and costs information on same scale in order to ascertain profits or losses at various levels of activity and to work out the activity point where there is no profit or no loss.
(iii) Margin of Safety:
It is the excess of budgeted or actual sales over the break-even sales volume or it may be expressed as output at full capacity minus the output at break-even point i.e.
Margin of Safety = Budgeted or Actual Sales – Sales at B.E.P.
It can easily be concluded that if the margin of safety is small, a small drop in production capacity may decrease the profits considerably. Thus there should be reasonable margin of safety otherwise it may be disastrous for the enterprise.
A low margin of safety is the indication of high fixed costs and to earn profit the organization will have to raise output level so that it is sufficient enough to absorb the fixed costs.
Margin of safety a is expressed as:
∆ = Actual sales volume – Sales at B.E.P./Sales at B.E.P.
or ∆ = Qa – QB/QB
where Qa = actual sales volume
QB = Break even sales volume
If the margin of safety is unsatisfactory then take following measures:
(i) Increase the sales price.
(ii) Reduce the fixed and variable costs.
(iii) Increase the output.
(iv) Drop the production of non-profitable products gives more attention to profitable products.
(iv) Angle of Incidence:
It is the angle at which total revenue line or sales line intersects the total cost line. If the angle is large, it is an indication that profits are being made at a high rate on the other hand, if the angle is small, it indicates that less profits being made and earned under less favourable conditions. In practice, management aims at widening the angle of incidence in order to improve the rate of profitability.
(v) Contribution:
Break even technique can be utilized to ascertain level of accrued earnings on a given volume of output or production and sales. In other words, the amount of contribution of a enterprise at a given level of output and sales is defined as the difference between total sales and total variable cost.
This will be referred to as contribution per period. On same lines contribution may be per unit also i.e. the difference between unit sales price and unit variable cost.
Further contribution per period will be equal to sum of fixed cost and profit.
Thus contribution is a measure of economic value that tells us how much the sale of one unit will contribute to cover fixed costs, with the remainder going to cover profits
i.e., Contribution per unit C = (Selling price per unit ‘S’) – (Variable cost per unit ‘V’)
C = S – V
Contribution Ratio:
When the contribution of a product is divided by its price, the result is called contribution ratio. It is used for comparing the profitability of several products within a product line. The product line as a whole should provide sufficient contribution to meet all fixed costs but individual products in a line, often cover different shares of the total fixed costs. In this way products with higher contribution ratio can be emphasized.
(vi) Profit-Volume Ratio:
Profit volume ratio known as P/V ratio, expresses relationship between contribution the value of the sales.
The P/V ratio performs a very important role in the solution of problems being dealt with the help of break-even analysis. The P/V ratio is the ratio of contribution to sales. In other words it indicates the relationship between contribution and sales revenue or turnover.
Mathematically,
P/V ratio = Contribution/sales x 100 = S – V/S x 100
or Total sales – Total variable cost/Total sales x 100 = 1/Variables Costs/Sales
or Selling price/unit – Variables cost/unit/Selling price/unit.
The P/V ratio may be employed to measure the relative contribution of products of an enterprise or measure the relative contribution of a product or organization for different periods. This can be done through the calculation of margin of safety and break-even points. The break-even point can be calculated by using the relation.
B.E.P = Fixed costs/P/V ratio
Similarly, margin of safety can be computed by using the relation.
∆ = Profit/P/V ratio
(vii) Profit Volume Chart:
Profit volume chart is modification of break-even chart where sales are represented on X-axis and the fixed costs and profits at different levels of sales are represented on Y-axis. Thus this is a diagram similar to break-even chart shown in Fig. 11.2, where fixed costs are marked as negative quantity on the ordinate.
The break-even point is given by the intersection of the income line with X-axis operation of the enterprise below the abscissa indicates loss and operation above it a profit.
The profitability ɸ of a product is indicated by the slope of the revenue or income line called Profit-volume of P/V ratio which is mathematically given by the relation
ɸ = fixed costs/Sales volume at B.E.P = F/QB = (revenue per unit variable cost per unit)
= Profit + fixed costs/Actual sales volume

Example 1:
Net sales = Rs 200,000
Fixed cost = Rs 65000
Net Profit = Rs 40000
Solution:
Refer to Fig. 11.2 when sales is zero fixed cost remains at Rs 65000 and when sales is Rs 200000 the profit is Rs 40000.
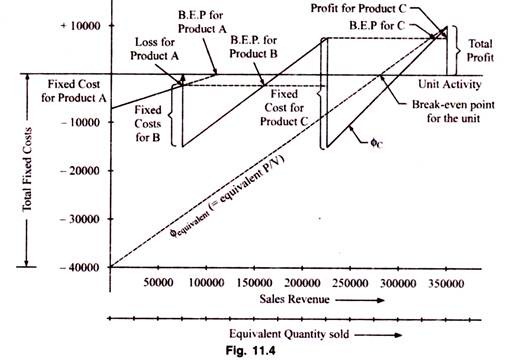
(viii) A Multiple Product Profit-Volume Chart:
A profit volume chart for three products A, B and C can be constructed as shown in Fig. 11.3 & 11.4, the total cost for all these three products A, B and C is plotted below the abscissa and profits above abscissa, the break-even point for the three products A, B and C and the combined or equivalent P/V (dotted line).
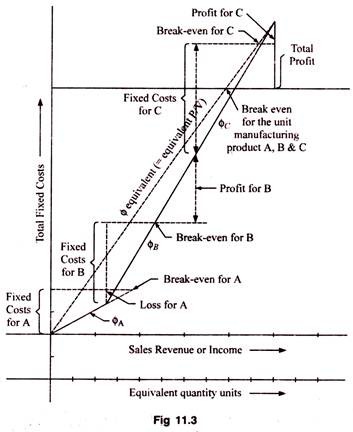
A profit volume chart for multi product is shown in Fig 11.4 .
In the Fig. 11.4 for the quantity of product a produced, a loss occurs hence ɸA is established. The figure is repeated for products B & product C also. The equivalent P/V line is drawn with the help of total profit and total fixed costs as shown in the two figures. This figure for multi products can help the management to take appropriate decision regarding the various products.
(ix) Calculations of Break- Even Point:
(For utilisation of fixed assets)
Let F represents the fixed cost of the assets for a given period. Further let S be the unit selling price.
V = Variable or marginal cost/unit P = Profit.
If the quantity be produced during the same period at which the income would just cover the expenditure
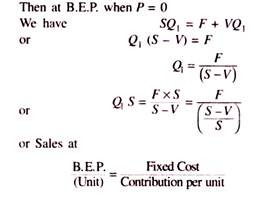

Fig. 11.2 readily gives at a glance the contribution to overhead and profits. The short term decision making is more concerned with contribution both overhead and profits than to consider profit figure alone.
Essay # 4. Applications of Break Even Analysis:
It can be used to determine the following;
(1) Quantity required to be produced to have desired profit.
(2) Effect of change in product price.
(3) Effect of change in product costs.
(4) Whether to accept an order or not.
(5) Whether to add or drop a product line.
(6) To take make or busy decisions.
1. Quantity Required to have Desired Profit:
It is given by the ratio of the sum of fixed cost and desired profit to the contribution per unit. Formula used is
Target quantity = Fixed Cost + Desired Profit/Contribution per unit
2. Effect of Change in Sales Price of Product:
Sometimes the management of a company is forced to consider a price reduction in view of severe competition in the market. The management has to consider the following facts in this regard.
Reduction in sales price leads to reduction in contribution margin. This will increase the sales volume. But this increased volume may or may not lead to proportional increase in the volume of sales because it depends on elasticity of demand of product.
The shifting of break-even point due to price variation is drawn in Fig. 11.6. At different price levels, total revenue lines have been drawn in this figure. The figure shows that as the price of the product is reduced to B.E.P. shifts towards right side and vice-versa.
Thus from this figure, one can estimate the sales volume and profit at each price level. From the break-even chart Q = (Break-even point in units) = F + P / S-V
where F = Fixed cost V = Variable cost P = Profit S = Unit sales price. As the sales price changes, the above equation changes.
Qn = F + P/Sn – V
(New Break even Quantity)
Sn= New Sales Price Qn = New B.E.P. in units

3. Effect of Change in Variable and Fixed Cost:
Change in Variable Cost:
An increase in variable cost shall lead to decrease in marginal profit per unit or contribution margin. Therefore the immediate question is what should be the new price of the product to maintain the present profit without disturbing the sales volume.
The break-even quantity is given by the relation
Q= F + P/S-V
and if Vn is the new variable cost, the new break-even quantity is given by relation
Qn= F + P /S-Vn
The new selling will be given by relation Sn = S + (Vn – V)

Change in Fixed Cost:
The fixed cost may change due to removal of obsolescence and modernization, increases in salaries, taxes, insurance or building rent etc. All these factors will bring change in break-even point assuming unchanged product price.
Now the break-even quantity is given by
Q = F + P/ S –V …(i)
The new break-even quantity (Qn for new fixed cost Fn same sales price and variable cost is given by
Qn= Fn + P/ S –V …(ii)
Subtracting (?) from (ii), we have
Qn– Q = Fn + P/ S –V …(iii)
If Q is same and sales price changes from S to Sn for new fixed cost Fn
Then Sn = S + Fn – F/Q …(iv)
4. Whether to Accept an Order or Not:
Sometimes the management of a concern is to decide whether to accept an order at a price with less than initial selling price of the organization if extra capacity to produce a product is available. For example, a plant manufacturing a certain product was operating at 50% of its installed capacity. A buyer offered to purchase 6000 units of the product at Rs. 6/- per unit while the average cost was Rs. 8/-.
The question was whether the order should be accepted. Other details of the product were as follows:
Total plant capacity = 20000unit
Present output = 10000units
Direct material cost = Rs 2000units
Direct labour cost = Rs 20000 units
Fixed cost of the unit = Rs 40000
Total cost = Rs 80000
Thus Average cost = Rs 8/- per-unit
In this question we find that the additional cost of producing 6000 units would be only Rs. 24000 (Rs. 12000/- for materials and Rs. 12000/- for labour). The incremental revenue by accepting the order for Rs. 6/- per unit would be Rs. 36000/- and company would gain Rs. 12000/-.

Thus it would be profitable to accept any order for more than Rs. 4/- per unit which is the direct cost. In such a situation, there is a danger that if other consumers come to know about the sale of the product at lower price they may also demand price reduction or else threaten to cancel their orders.
Therefore, in such cases acceptance should be kept secret. Ideally each product should make significant contribution to common costs but it is not possible to state a thumb rule for determining satisfactory or unsatisfactory contribution made by different product lines. In competitive situation product pricing decisions should be made with a view to maximise concern’s profit in long run.
5. Whether to Add or Drop a Product Line:
The management of any business organization is normally confronted with problems while deciding among the alternatives to add or drop a product line.
The two situations may be:
(1) Should a new product be added in view of the forecasted revenue and costs?
(2) If a product line is dropped from the production steam, what would be the consequent effects on revenues and costs? Break even analysis can be helpful in taking decisions in such situations.
Break even analysis can be helpful in taking decisions in such situations.
Example 2:
The product price and cost data of a plant is as follow:
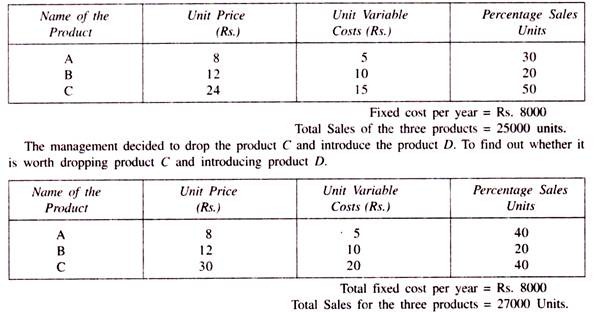

6. Whether to Make or Buy:
Break even analysis can help in taking Make or Buy decisions. In these decisions, it is to be decided whether to utilize the infrastructural facilities or not. Assuming the cost to purchase proportional to the quantity purchased the break-even point can be plotted as follows:
Suppose Q be the quantity corresponding to break-even point which can be written as
Q = Fixed Cost Sales/Purchase Price – Variable Cost
In order to take make and buy decision after determining Q, if the quantity required is less than Q, it is cheaper to buy and for more than Q it is cheaper to make.
Example3:
A manufacturer of lathes buys a component at Rs. 20 each. If he decides to make it himself his fixed and variable cost will be Rs. 24000 and Rs. 8/- per component respectively. Decide whether to make or buy the component.
Solution:
B .E.P (No. of Components)
= Fixed Cost/Sales/Purchase Price – Variable Cost
= 24000/20 – 8 = 2000
The interpretation is that if the manufacturer wants more than 2000 components. They should be manufactured in the plant and if less than 2000 components, they should be taken from the same supplier.

Essay # 5. Advantages of Break Even Analysis:
(1) It is very helpful for forecasting results.
(2) An important tool for decision making in order to accomplish desired objectives.
(3) The effect of change in unit sales price and cost of production on profit can be determined.
(4) Provides more realistic basis policy making.
(5) The situation of dividend payment to start can be determined with the help of B.E.A.
(6) B.E.A. can help in giving indications about desirable unit selling price in view of some predetermined policy.
Essay # 6. Limitations of Break Even Analysis:
B.E.A. is useful in many business situations for the purpose of decision making but there are many short-comings in its analysis and interpretations.
Some of these limitations are as follows:
(1) The unit sales price of the product/item or services is dependent on factors affecting its demand and supply. So variation in sales price will affect the demand of the commodity. This process is not covered in the break-even analysis.
(2) The fixed costs may not remain fixed or constant as assumed.
(3) The variable costs may not vary in fixed proportions at various levels of output.
(4) For sales promotion purposes consumers are given certain discounts. In such cases revenue may not be perfectly variable with level of sales output.
(5) For all types of products/commodities, the assumption of producer’s market phenomenon may not hold good.
(6) A shift in the product mix may change the location of break-even point.
(7) Identification of variable and fixed cost involved in a production process are not very simple.