After reading this essay you will learn about:- 1. Size and Growth Rate of Population 2. Birth Rate and Death Rate 3. Age Structure of Population 4. Infant, Child and Maternal Mortality Rates 5. Sex Ratio of Population 6. Effects 7. Rural and Urban Population 8. State Wise Area and Density of Population in India and Others.
Essay Contents:
- Essay on the Size and Growth Rate of Population
- Essay on the Birth Rate and Death Rate
- Essay on the Age Structure of Population
- Essay on the Infant, Child and Maternal Mortality Rates
- Essay on the Sex Ratio of Population
- Essay on the Effects of Population
- Essay on the Rural and Urban Population
- Essay on the State Wise Area and Density of Population in India
- Essay on Population and Literacy
- Essay on the Expectation of Life at Birth
- Essay on Population Problem of India
Essay # 1. Size and Growth Rate of Population:
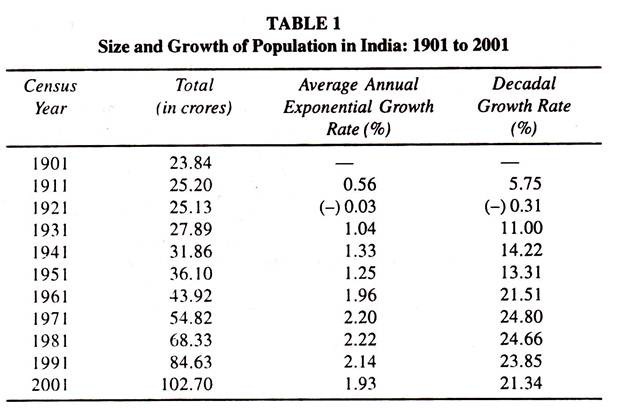
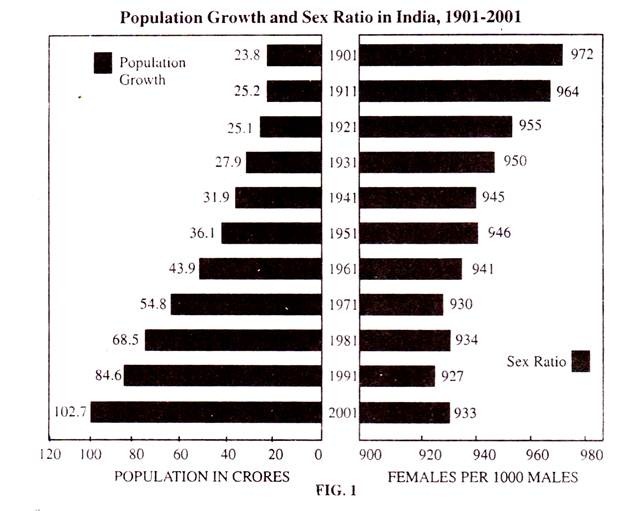
India’s population has grown steadily from 1901, except for a decrease in 1921. It increased from 23.8 crore in 1901 to 36.1 crore in 1951 and further to 102.7 crore in 2001, as shown in Table 1. It reveals that during the first 50 years from 1901-1951, population grew by 12.3 crore while during the next 50 years from 1951-2001, it increased by more than 5 times, that is, by 66.6 crore.
These stages are to be given if there is a separate question on them.
The growth of population in India can be divided into four phases as under:
(i) Phase of Stagnant Population: 1901-1921.
During this period, population increased by 1.29 crore only. If we were to break this period in accordance with the two censuses, we find that during 1901-11, the decadal growth rate was only 5.75 per cent, as the natural growth rate of population was low (6.6). But in the next decade (1910-21), the growth rate of population declined to (-) 0.3 per cent.
This was due to high death rate (47.2) on account of famines and epidemics like plague, cholera and malaria which took a heavy toll of human lives. The year 1921 is, therefore, known as the year of Great Divide.
(ii) Phase of Steady Population Growth: 1921-51.
From 1921 onwards till 1951 there was a steady growth of population. During these years population increased by 2.8 crore in 1931, to 4 crore in 1941 and to 5 crore in 1951. But the dacadal growth rate in 1951 census was 0.9 percentage less than in the 1941 census due to the Partition of India in 1947. The main reason for the steady increase in population was the decline in death rate from 36.3 to 27.4 and of birth rate from 46.4 to 39.9 over the period. This resulted in an average natural growth rate of 12.2 during this phase of 30 years.
(iii) Phase of Rapid Population Growth or of Population Explosion: 1951- 1981.
This was the period of rapid population growth when population increased by 32.5 crore as against about 12 crore during the last 50 years from 1901 to 1951. The average annual growth rate of population increased from 1.25 per cent to 2.2 per cent in 1981. The main reason was a large decline in the death rate from 22.8 to 15 due to better medical facilities while the birth rate fell slowly from 41.7 to 37.2 over the period. This led to population explosion in the country.
(iv) Phase of High Growth with Declining Trend: 1981-2001.
During this phase, a definite declining trend of population growth is visible. Total population increased by 34.37 crore during 20 years. But the average annual growth rate had definitely declined to 1.93 per cent in 2001 as against 2.2 per cent in 1981. However, the trend of population explosion still persists even now.
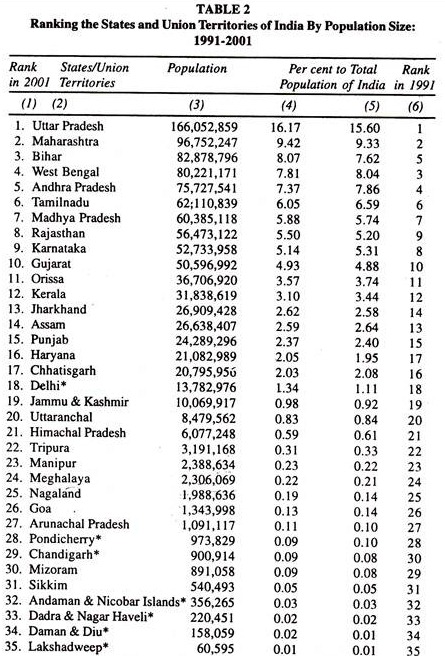
As per the Census of India, 2001, the relative share of population of the States and Union territories to the total population of India is shown in Table 2. This table also shows the sizewise ranking of population in different States and Union Territories of India for the years 1991 and 2001. According to this table, Uttar Pradesh is the most populous State in India with more than 16.60 crore of population which is more than the population of Pakistan, Russian Federation, Bangladesh, Japan and Nigeria, ranking as sixth, seventh, eighth, ninth and tenth most populous countries of the world respectively. The population of these countries in the Year 2000 was 15.65 crore, 14.69 crore, 12.92 crore, 12.69 crore and 11.15 crore respectively.
Table 2 also shows that there are nineteen States with more than one crore population. Uttar Pradesh, Maharashtra, Bihar, West Bengal and Andhra Pradesh are such States in which almost half of India’s population lives. Rank wise, Uttar Pradesh and Maharashtra are at the first and the second position respectively, while Bihar stands at the third position in 2001. It had at the fifth rank in 1991.
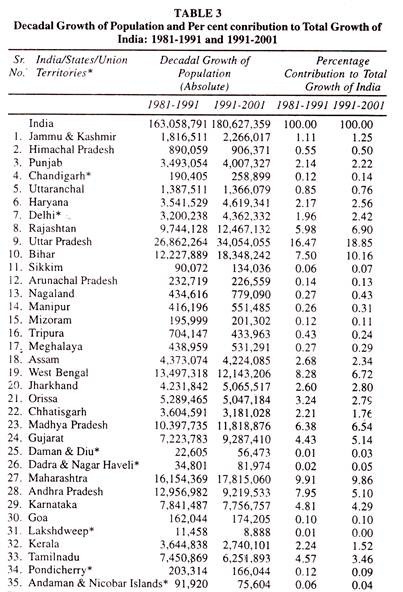
During the census decade 1981-9land 1991-2001, the absolute increase in population and the percentage contribution of each of the States and Union Territories to the total population in India are presented in Table 3. This table shows the increase of population in India during 1991-2001 compared to 1981- 1991.
But in some States and Union territories a reverse trend in population growth has been found in this respect. Andhra Pradesh, West Bengal, Kerala and Tamil Nadu are the States where the most significant drops in the net addition are found, while in Uttar Pradesh, Bihar and Rajasthan the net addition of 1.6 crores to population has been found during 1991-2001 in comparison with the previous decade 1981-1991.
Along with Madhya Pradesh, Uttar Pradesh, Bihar and Rajasthan, their contribution to the population growth during 1981-91 was about 36 percent while it was 42 per cent during 1991-2001. On the other hand, India’s population grew by only one per cent during 1991-2001, if the data of other 16 States and Union Territories is seen.
Besides, in 1991-2001 as compared to the decade 1981-1991, a decline in absolute growth has been found in as many as 14 States and Union Territories. 39.02 per cent of India’s population is found in these 14 States and Union Territories.
Essay # 2. Birth Rate and Death Rate:
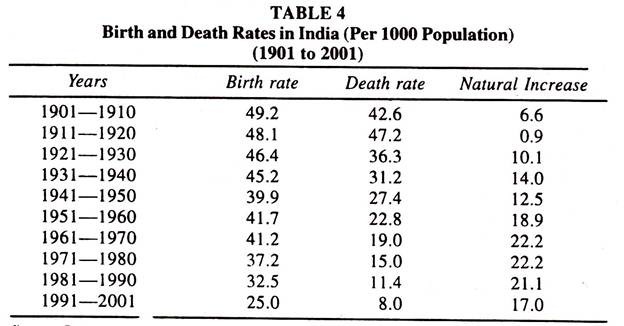
The total number of births per 1000 people in a given area at a given time is called the birth rate, while deaths occuring per thousand people in a given area in a given time is called the death rate. The birth rate, the death rate and the natural growth rate are shown in Table 4. When the birth rate, the death rate and the natural growth rate are studied for the period from 1901 to 2001, a number of interesting facts emerge.
For the period between 1901 and 1910, both the birth and death rates were high, being 49.2 and 42.6 respectively. It means that in India during the decade 1901 to 1910, 49.2 children per 1000 persons were born and 42.6 persons per 1000 died. Consequently, the net increase in population was 6.6. During 1911 to 1920, the natural increase of population per 1000 was 0.9. The decrease in Indian population was noted during this decade only.
The birth rate during 1941- 50 was 39.9 and the death rate was 27.4. The natural increase was 14.0 during the previous ten years which decreased to 12.5 during 1941-50. But after that up to 1971-80, there was continuous increase of 18.9 in 1951-60 and of 22.2 between 1961-80. For the period 1981-90, the rate of natural increase declined to 21.1. For the decade 1991-2001, it was 17.
The decline in birth rate and death rate had been very slow till the 1990s because of the lack of proper planning, inadequate implementation and little monitoring of mother and child health programmes. It was only in the Eighth and Nine Five Year Plans that a new thrust and dynamism to the family welfare programme was given which resulted in bringing down the birth, death and natural rates to a somewhat low level.
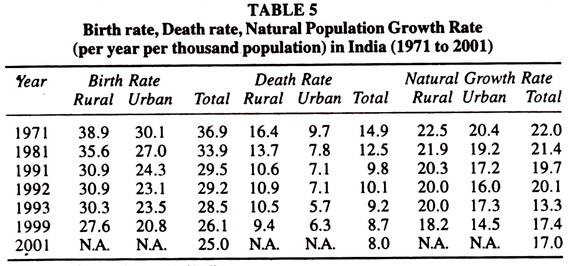
In India, the birth rate, the death rate and the natural growth rate in rural and urban population are shown in Table 5. This shows that in 1971, the birth rate in rural India was 38.9 and death rate was 16.4. The corresponding figures for 1999 are 27.6 and 9.4 respectively.
The natural growth rate decreased from 22.5 to 18.2 during this period. In comparison to this in 1971 in urban areas, the birth rate was 30.1 and the death rate was 9.7, whereas in 1999, they were 20.8 and 6.3 respectively. The natural growth rate decreased from 20.4 to 14.5 during this period.
It shows that in comparison to urban areas, the birth rates and death rates are high in rural areas. The total birth rate, death rate and natural growth rate in 2001 were 25.0, 8.0 and 17.0 respectively.
The main reason for high birth rate, death rate and natural growth rate of population in rural areas has been insufficient and ineffective maternity and child health services.
Essay # 3. Age Structure of Population:
In the females of particular age group, the number of live births per thousand female population of that age group in a given year is called the age-specific birth rate. It is very important considering that there had been decrease in the birth of child in India at a lower age.
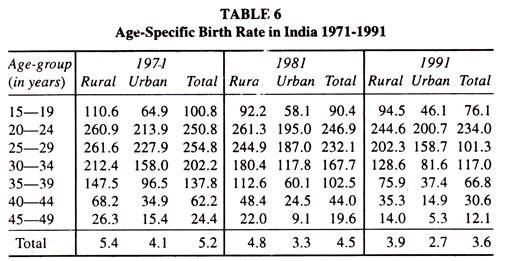
In 1971, in the females of age group 15-19, the birth rate in rural and urban areas was 110.6 and 64.9 respectively. Thus, the total was 100.8. It decreased to 84.5 and 46.1 respectively in 1991 and the total birth rate became 76.1.
Against this, in the females of age group 20-24 , there was increase in this size. In 1971, the birth rate in the females of that age group in rural and urban areas was 260.9 and 213.9 respectively. The total was 250.8 which in 1991 decreased to 244.6 and 200.7 respectively. The total was 234. In this way, there had been decrease in the birth rate of rural and urban females of age group 15-49 years, as shown in Table 6.
Age-Specific Death Rate:
Age-specific death rate means the number of persons dying in a particular age group per 1000 persons of that age group in a given year.
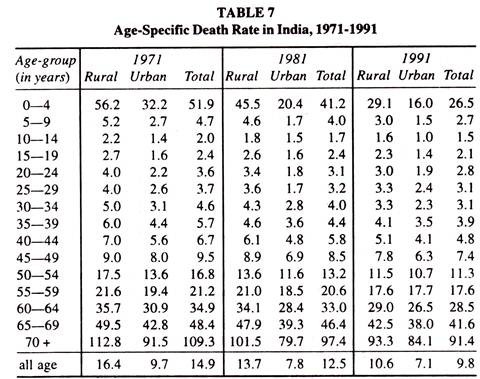
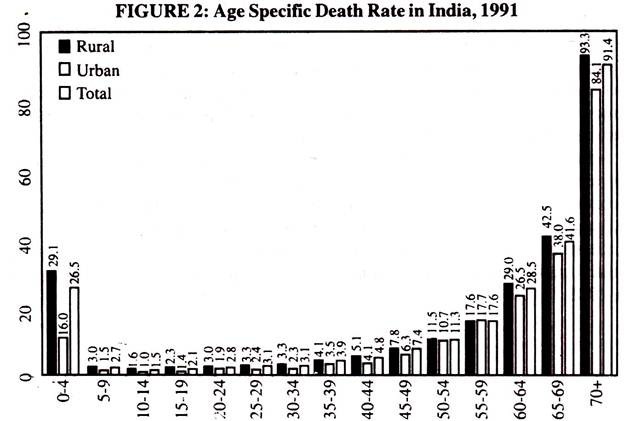
In India, in comparison to 1971, in 1991 there had been decrease in the death rate of age group 0-4 year but in comparison to the urban population, in rural areas the death rate was high. In 1991, the death rate in urban areas of age group 0-4 years was 16.0 while in rural areas it was 29.1.
Thus the total death rate was 26.5 whereas the death rate in old age (age group of 70 +) in urban areas in 1991 was 84.1 and in rural areas it was 93.3 which decreased to 91.4. While in total age-specific death rate this ratio was 9.7 in urban area and 16.4 in rural areas in 1971. Thus, the total was 14.9 which decreased to 7.1 in urban areas and 9.8 in rural areas in 1991, as shown in Table 7 and Figure 2.
When the percentage of deaths due to main causes according to age and sex are observed in rural areas, it reveals that during 1991, in the age group 15-25 years, there was high death rate due to accidents and injuries. As a result, 19.9 per cent males and 27.7 per cent females of this age group died, while in the age group of 1-4 years there was high death rate of 15.8 per cent in males and 20.6 per cent in females due to digestive disorders.
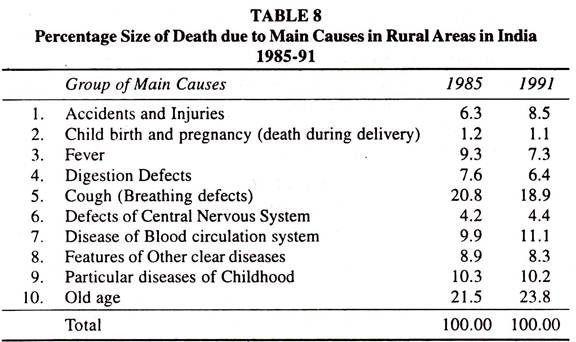
In India during 1985 and 1991, the percentage of deaths due to main causes in rural areas are given in Table 8 which shows that in comparison to 1985, the percentage of deaths due to accidents and injuries in 1991 had increased from 6.3 per cent to 8.5 per cent and the number of deaths due to diseases of blood circulation system had increased from 9.9 per cent to 11.1 per cent, while the deaths caused due to other reasons changed negligible in 1991 in comparison to 1985.
Essay # 4. Infant, Child and Maternal Mortality Rates:
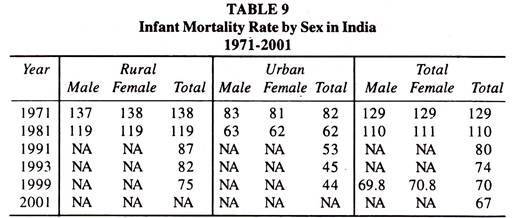
The number of infants below one year of age dying in a year per 1000 live births of the same year is called the infant mortality rate. In India, during 1971-2001, the sexwise rural, urban and total infant mortality rate is shown in Table 9. This shows that in rural areas, the infant mortality among males in 1971 was 137 and in females 138.
The total being 138. In urban areas, this was 83, 81 and 82 respectively. The total for the country was 129. In 1981, in rural areas, the infant mortality in males and females was 119, while in urban areas, it was 63 and 62 respectively.
The data of infant mortality according to sex, not being available for 1991. 1993 and 1999, the rural, urban and total infant mortality data are available, which show that in 1999 in rural areas, the infant mortality rate was 75 and in urban areas 44 and the total was 70, which is less in comparison to 1971. It declined to 67 in 2001.
Table 10 shows child (0-4 years) mortality rate (per 1000 live births) from different sources, as there is no system for collection of data in India on morbidity during childhood. The table reveals that there had been a decline in the child mortality rate over the years from 57.3 in 1951 to 19.5 in 2001.
But there had been a marked decline during the 1990s due to mass immunization, food and micro-nutrient supplementation and prevention of acute respiratory infection and diarrhoeaprogrammes of the Government.
Similar is the case with maternal mortality rate (MMR) for which data for 1991 and 2000 are available. MMR (for 1, 00,000 live births) was 437 in 1991 which increased to 540 in 2000. The major causes of maternal mortality have been unsafe abortions, antepartum and post-partum haemorrhage, anaemia, obstructed labour, sepsis, etc.
Essay # 5. Sex Ratio of Population:
In relation to the sexual status of population in a country, the ratio of male to female of that country is important. Generally, the number of males and females is not equal in any country. It means that many a time, in comparison to females, the number of males is high.
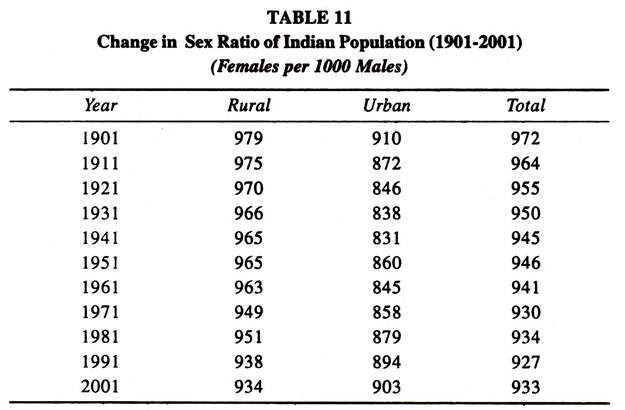
In the census of India, the male-female ratio is measured as the number of females per 1000 males. The rural, urban and total changes in sex ratio in India are shown in Table 11 which shows that it has generally been averse to women.
During 1901 to 1941, there was a continuous decrease in this ratio in India. The ratio was 972 in 1901 which decreased to 945 in 1941. In the following decades, due to the partition of the country, people came to reside in India. As a result, during the decade of 1941 to 1951, this ratio remained constant.
In 1951, it was 946 which decreased to 941 in 1961. During the decade 1971-81, the male-female ratio in the whole country increased from 930 in 1971 to 934 in 1981, which decreased to 927 in 1991 and again increased to 933 in 2001.
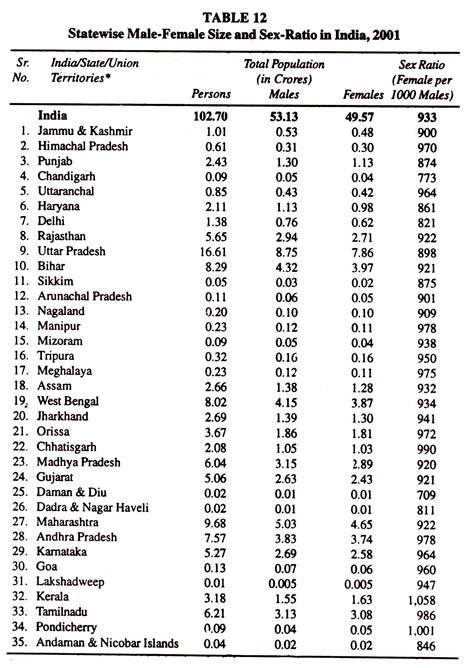
The sex ratio of the total population of different States and Union Territories in India in 2001 is shown in Table 12. It reveals that Kerala is the only State in India, where the number of females is higher than that of males. It was 1058 females per 1000 males.
In the Indian context, a sex ratio of 950 and above can be considered as favourable. The States coming under this ratio besides Kerala were Chhattisgarh (990), Tamil Nadu (986), Andhra Pradesh (978), Manipur (978), Meghalaya (975), Orissa (978), Himachal Pradesh (970), Uttaranchal (964), Karnataka (964), Goa (960) and Tripura (950).
Among the Union Territories, Pondicherry led with 1001 females per 1000 males with Daman- and Diu having the lowest sex ratio of 709. Among the States, Sikkim was at the bottom with 875 sex ratio.
There are many reasons for low sex ratio in India. The preference for the male child is still prevalent among Indians. In fact, the adverse sex ratio is a reflection of gender bias. Female infanticide, sex determination tests and selective female foeticide are also partly responsible for this.
Thus pre-natal and post-natal deaths of females are common despite the law against them. The death rate among women in the reproductive age group 19-45 years is also high. It ranges between 300-400 per 1000 females. It is still higher among those who marry early in the age group 11-19 years. Thus high female death rate is the main cause for low sex ratio.
During 1941-51 the number of males and females remained constant. During 1971-81, it increased from 949 in 1971 to 951 in 1981, declined to 938 in 1991, and to 934 in 2001.
There was decrease in male-female ratio in urban areas, from 910 in 1901 to 831 in 1941. It increased to 860 in 1951 but decreased to 845 in 1961 and again increased to 858 in 1971, to 879 in 1981, to 894 in 1991, and to 903 in 2001.
The above analysis of sex ratio reveals that the sex ratio in urban areas is less than that in rural areas in India because people who migrate to urban areas keep their spouses in villages, as housing facilities are not available in towns.
Essay # 6. Effects of Population:
(i) Effect on Environment:
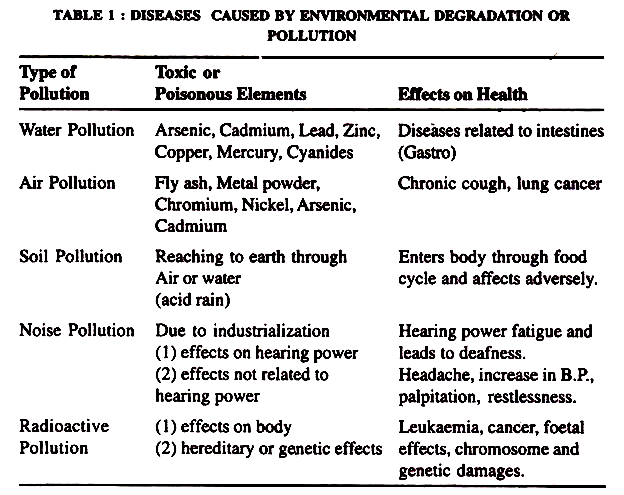
In order to provide shelter, food, fuel, health and other primary facilities to the increasing population, the forests are being destroyed, deep dredging is done in the seas, the rivers and seas are made dumping grounds for industrial wastage, deep mining is done in the land to get coal, minerals, oil and natural gas, etc., atomic bombs are exploded and nuclear power stations are being commissioned.
Thus, due to rapid industrialisation based on the modern technology and due to more and more exploitation of the natural resources, various types of unnecessary and undesired chemicals in solid, liquid and gas forms enter the atmosphere and the earth’s surface.
These substances are called ‘pollutants’. They create hindrances in the bio cycles of the living substances. Their extent is increasing day-by-day and so their toxic effect is now visible.
Pollution is a by-product of urbanization and modern technology. It is a man-made hindrance to the ecological balance. Nobody is free from the evil effects of pollution. Living things like plants, animals and human beings and non-living things like air, water, atmospheric temperature, etc. become victims of their evil influence.
Pollution is not desirable. The best solution is that we should not allow it to happen. One expert has said that “By 2025, atmosphere will be so poisonous that we will not be able to live. Our earth might have become a huge cemetery”. Thus, the pollution problem is a matter of life and death for the human beings. We must slow down its speed. It is essential to prevent it.
If we take measures on a war footing, the demon of pollution will be destroyed and our future generations will live happily with peace and comfort.
Population as the Greatest Pollutant:
One of the factors responsible for environment degradation is population growth or population density. In particular, population density plays the most important role in shaping the socio-economic environment. Its effect is felt on the natural environment also. The majority of Indian population is poor and its poverty causes great damage to environment. So poor people damage environment and become its victims too.
As part of environment, a human being does not live in peaceful coexistence with other constituents, but comes into conflict with them for his own self-interest.
Due to his destructive activities, man has:
1. dumped more and more wastes in environment. As the man made waste is not transformed, it causes degradation and the capacity of environment to absorb more waste reduces;
2. extracted more and more minerals from the earth. Animals have been hunted and plants have disappeared. There has been loss of bio-diversity. These have led to ecological imbalance;
3. established new housing colonies. National highways and hydropower projects have been built and forests have been wiped out. These destructive activities have increased and led to ecological imbalance; and
4. developed technology which releases gases and other pollutants causing chemical and industrial pressure on environment.
Due to the above mentioned supplementary effects, the following changes have been noticed in various parts of the world:
1. Seasons have become irregular.
2. There is change in earth’s temperature.
3. There are sudden snowfalls.
4. There is increase in oceanic storms and typhoons.
5. Rain has become irregular. There is excess rain leading to floods or scanty rain leading to permanent drought situation in many parts of the world.
In India, the basic cause of environmental degradation is rapid population growth. 16 percent of the world population lives in India, While it covers only 2.4 percent of the land mass of the world. Due to medical facilities and social changes, the death rate has declined faster, while the birth rate has declined slowly.
Dandekar has analysed the decreasing death rate and birth rate between 1972-1978 and 1979-1990 and has noted that the death rate in the second time period has declined more rapidly than in the first.
The decrease in birth rate in the second period is less than that in the first. Due to this, poverty could not be eradicated, though removal of poverty has been a national agenda for more than 50 years. In the Stockholm Conference on Environment in 1972, the then Prime Minister Mrs. Gandhi said that poverty is the greatest pollutant. After 20 years, the World Bank said, “Poor people are the cause and witness of increase in environmental pollution and pollution degradation.” When poor are witnesses to pollution degradation, then only they become their originators or agents.
Environment also adversely affects human development.
There are two indicators of environment:
(a) Facility for pure drinking water, and
(b) sanitation. They are closely related to two important indicators of human life viz., infant mortality and life expectancy at birth.
Polluted air and filthy slums adversely affect health, reduce life expectancy and increase infant mortality rate (IMR). Even today life expectancy at birth is quite low and the IMR is more than what it should be. So higher population leads to more poverty and more environmental degradation. Thus a vicious circle is created.
Urbanization:
Rapid growth of population has led to urbanization which has adversely affected environment. Urban population in India is increasing at an annual rate of 3. 5 per cent and the cities are experiencing many complex problems related to environment.
Due to population pressure, the natural resources in the cities are depleted at a fast rate due to population pressure, and a third of the population does not have proper sanitation or pure drinking water. As a result, the health of the people is adversely affected. No doubt, urbanization reduces pressure on the rural environment, but it brings with it environmental damages through industrial growth, emissions and wastes.
Disposal of Wastes and Harmful Substances:
Due to rapid urbaniztion, solid waste has increased both in absolute and relative terms. The surveys undertaken to study the origin of solid waste, its collecting, processing and its disposal in 345 class I and II cities, show that a very small portion of solid waste is properly collected and disposed off.
The main problems are its collection, transporting it from one place to another and its disposal. The task of assorting solid waste in India is not uncommon, as the scavengers or in some areas NGOs do the recycling work. ‘It is necessary to develop proper places for liquid waste so as to make it flow over the ground.
When the solid waste is not properly and effectively collected and disposed off, it attracts flies and animals like rats which spread diseases. They also damage earth and weather resources. If this waste is not properly disposed off, it will decay and biogas will be produced, which is a greenhouse gas and has 34 times more capacity than carbon dioxide to keep the earth warm.
So it is necessary to develop proper technologies to dispose off solid waste so that there is minimum effect on health and environment. The Central Pollution Control Board gives proper guidelines for disposal of toxic waste including hospital waste.
According to a study done on the solid waste in Delhi, it was found that the average daily production of solid waste under the Delhi Municipal Corporation was 5,327 tonnes. Its analysis showed that 47 percent waste had bio-degradable substances, recyclable elements included paper and cardboard (6.7 percent), plastic (4.17 percent) and metal (1 percent).
If these are sold, crores of rupees can be earned. Most of the solid waste collected by municipalities can be reusable. The techniques and technologies for this are ready which are commonly used in many nations and are economically beneficial too.
Disposal of Plastic Waste:
As use of plastic has many benefits, it is widely used in the world. It is light, flexible for giving shapes, and can be used in various uses as per need. But it is difficult to destroy and so it is called non-biodegradable. On the other hand, it is easy to recycle it.
Plastic industry has developed fast in India. Demand for polymer is two times the rate of development and it trebles every 10 years. Per capita use of plastic now (1.6 kgs) is likely to go up to 4 kgs. 60 per cent of plastic used in India is recycled, which is the highest in the world.
But the remaining 40 per cent lie on the ground or in open gutters or in heaps. Even if this was recycled 3-4 times earlier, the collection of such solid waste at a place is harmful for recovery of material and also ignores the benefit to environment due to material recycling.
Thus plastic waste lying unattended is the cause for concern. It can choke municipal gutters or may create obstacles in the flow of storm water in the hilly areas or may become cause of death of many animals, especially as the cows eat food contained in polythene bags.
(ii) Effect on Nutrition:
In India, malnutrition is a serious problem due to poverty and unemployment. The problem of malnutrition is mainly found among infants, non- school going children, socially and economically backward pregnant women and mothers.
According to one estimate, 30 percent of the newborn babies in India are underweight. According to some studies conducted in the rural areas of some states, 37 per cent, 43 percent and 8.7 percent children were suffering from milk, moderate and severe malnutrition respectively.
In India, the rate of blindness due to vitamin A deficiency is 0.04 percent. In almost all the states, people seem to be suffering from iodine deficiency. According to one estimate, about 20 crore persons are suffering from diseases caused by iodine deficiency.
Almost 50 per cent of non-school going children and 50 per cent of women in advanced pregnancy are victims of anaemia due to iron deficiency. Even today one finds gender-based discrimination in food intake due to social customs and traditions. Sometimes the seasonal shortage of food grains also affects children’s nutrition. They become weaker and weaker by falling victims to malnutrition and their capacity to regain health also declines.
Food grain production in India has much increased since 1950-51. Still various figures on poverty show that there are 300 million people below the poverty line. According to the 55th round of NSSO on poverty estimates, 26.6 per cent population of India was living below poverty line in 1999-2000 and the number of poor people was 26.3 million.
At this level, there is not even food security, forget about nutrition security. If one takes getting two square meals a day as an indicator during recent years, the level of hunger has gone down from 16 to 8 percent. But this 8 percent means that the number of Indians not getting two meals a day is 75 million.
The per capita daily availability of pulses which is the most important sources of protein, was 35 gms. in 2002. Pulses are fourth in the rank while protective foods (fruits, fish, meat, etc.) are consumed only on some days in a year. The reason for this is the low income.
As a result, the average calorie intake in India is 2280, which is less than the recommended minimum intake. Except in West Bengal, Sikkim and Punjab, in almost all the states, intake of vitamin A is much less than the Recommended Dietary Intake (RDI), while in the low income families in the rural areas, the average intake is 53 g/cu against the RDI of 60 g/cu. The calorie deficiency is more in the children (60 percent) than among the adults (44 percent).
Due to food and nutrition deficiency among the poor, 30 percent of the newborns weigh less than 2500 gms. which is the cut off level of low birth weight used for determining probability of survival by the WHO. Deficiency in nutrition is due to poverty and it increases due to ignorance and lack of health and nutrition education.
(iii) Effect on Health:
Rapid Population growth leads to poverty and poverty creates problems of malnutrition and health. Due to malnutrition, people remain weak and disease- affected. They suffer from diseases like T.B., Typhoid, Cough, Eye ailments, skin diseases, etc. These problems of malnutrition, health and diseases are aggravated by environmental pollution. The poor are both the victims and agents of environmental degradation.
(iv) Effect on Productivity:
Environmental degradation not only harms health but also reduces economic productivity. Search and dirty water, in adeqate sanitation, air pollution and land degradation cause serious diseases on an enormous scale in developing countries like India.
These in turn reduce the productivity levels in the country. To take specific instances, water pollution has led to declining fisheries in rivers, ponds and canals in both urban and rural areas. Water shortages have reduced economic activity in towns, and cities and villages.
Soil and hazardous wastes have polluted ground water resources which cannot be used for agricultural and industrial production.
Soil degradation leading to soil erosion, drought, etc. have led to siltation of reservoirs and blocking of river and canal transport channels. Deforestation has led to soil erosion and consequent loss of sustainable logging potential.
Loss of bio-diversity has resulted in the loss of genetic resources.
Last but not the least, atmospheric changes have given rise to disruption of marine food chain, damages to coastal infrastructure due to sea-rise and regional changes in agriculture productivity due to hurricanes in seas.
Thus, environmental degradation undermines economic productivity of a nation.
Essay # 7. Rural and Urban Population:
It is a traditional methodology in the census of India to notify the rural and urban population. The use of the word “RURAL AREA” and its meaning is adopted for people living in villages, one which gets affiliation from the general district officeron the basis of the boundaries of land revenue paying villages.
In the land revenue paying villages, it is not necessary that there should be population, but it is necessary to have definite protected boundary.
With reference to different censuses, the question of necessity of population in a village has been disputed. In the previous censuses, only those villages were counted as villages where uninhabited villages were not accepted as villages. In 1961, the uninhabited villages were also included in the villages but in the 1971 census, those villages were known as uninhabited villages.
In 1981, too, this method was adopted. Thus, according to the 1981 census, “land revenue paying villages†are those, whose boundaries are well-defined and the registration of land is separate. Later on, the population of that area may live as residential population. This type of known groups are called ‘hamlets’.
These hamlets neither have the particular well-defined boundary nor do they have any particular marks for their recognition. Hamlets remain within the regional boundaries of villages.
Many villages are such that after accepting them as ‘villages’, they are included wholly or partially in the developed cities. But these types of villages too, with an aim of land revenue, accepts the affiliation as ‘villages’ by the State government.
Thus, there is negligible population in these villages and they are shown to be uninhabited villages in the census report. In addition to this, there may be unprotected villages in forests, in areas where only the labourers working in forests and their families reside.
Rural-Urban Population:
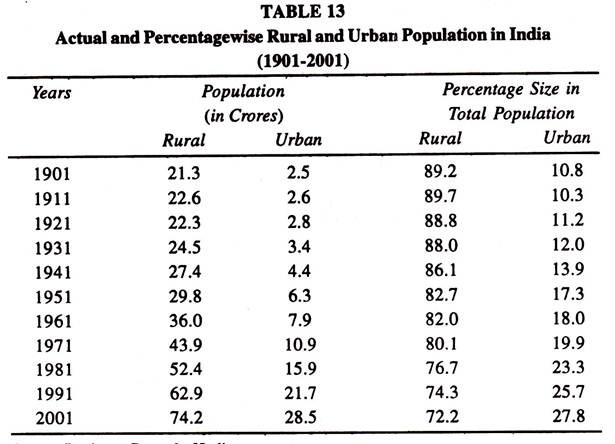
In India, the rural and urban population and percentage ratio of rural and urban population in total population from-1901 to 2001 are shown in Table 13. It shows that according to the 2001 Census, 72.2 per cent of the total population lived in rural areas, whereas more than 80 per cent lived in them from 1901 to 1971.
This shows a decrease in population living in rural areas of India. Out of all the States of India, the size of rural population was the highest in Uttar Pradesh, being 13.1 crore in 2001. The size of urban population in India has been increasing over the period 1901 to 2001. There had been marked increase from 19.9 percent in 1971 to 27.8 percent in 2001.
In India, Maharashtra is the State with the highest urban population of 4.1 crore in 2001. This has been due to rapid industrialization. Uttar Pradesh and Tamil Nadu follow Maharashtra. Urban population in these States was 3.4 crore and 2.7 crore respectively in 2001. Sikkim is the State having the lowest urban population of 60,005.
Essay # 8. State Wise Area and Density of Population in India:
One of the important indices of the concentration of population is the density of population. The highest density of population is found on agriculturally fertile lands, while it is the lowest in desert or rocky areas. Thus, population is not distributed equally in all parts of the country. In some parts of India, people live in small numbers and in other places they live in large numbers.
The pattern of distribution of population in any country can be described by its density of population, shown as
In other words, the total number of persons living per sq. km. area is called the density of population.
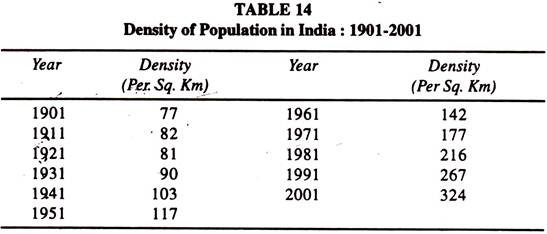
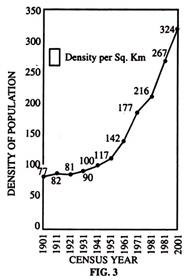
In India, the density of population has been increasing since 1921, as shown in Table 14. It was 81 persons per sq. km. in 1921, which increased to 117 persons in 1951 and to 324 persons in 2001.
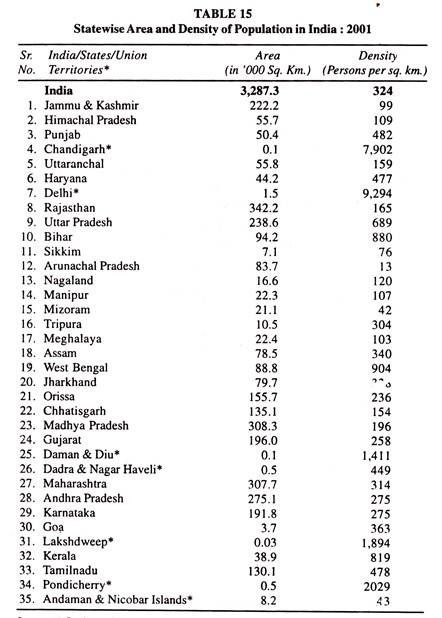
In India, the State wise area and density of population are shown in Table 15 and Figure 3. From the view point of geographical area, Rajasthan ranked first among Indian States with an area of 342.2 thousand sq. km., while the smallest area was that of Goa with 3 thousand sq. km in 2001. Among Union Territories, the largest area was Andaman and Nicobar with 8.2 thousand sq. km. while the lowest was Lakshadweep with 0.03 thousand sq. km.
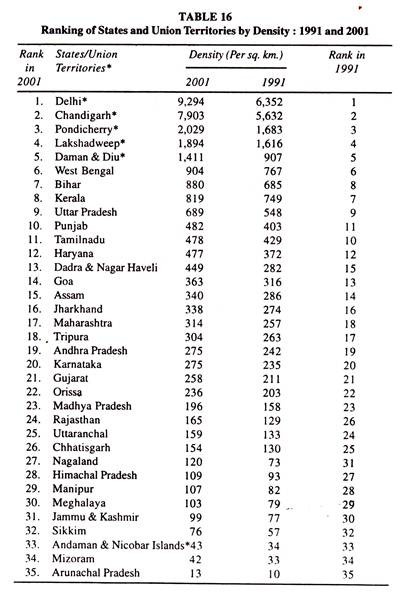
Ranking of States and Union Territories of India in descending order in densities is shown in Table 16. There are wide variations in density of population across the States and Union Territories. Among the States, West Bengal was at the top with density of 904 per sq. km and Arunachal Pradesh was at the bottom with 13 per sq. km. of density in 2001. Among the Union Territories, Delhi had the highest density of 9,294 per sq. km. and Andaman & Nicobar the lowest with 43 per sq. km.
But density of population does not reflect either the prosperity or the poverty of a State. For instance, Bihar is a poor State but it ranks second among the States of India in terms of density, being 880 per sq. km. On the other hand, Maharashtra is one of the prosperous States with density of 314 per sq. km. The same criterion applies to poor and rich countries of the world.
Essay # 9. Population and Literacy:
For rapid economic development of any country, education is the key factor. Education is an important necessity in the lives of citizens. The basis of future development of the country depends on its educational level. There are many viewpoints regarding the significance of ‘LITERACY’.
According to many writers, ‘literate people’ means such persons who can read and write in their mother tongue while ‘semi-literate people’ are those who can only read but cannot write. In India, illiterates are those who cannot read and write in any language.
On the other hand, literates are those who are able to read and write in any language. In other words, literacy means the efficiency of reading and writing in one’s own mother tongue.
In India in the 1951, 1961 and 1971 census all persons aged 5 years and above were taken as literates. But in the subsequent censuses of 1981, 1991 and 2001, persons of 7 years and above were enumerated as literates.
Literacy ratio can be known by the following formula:
where, L = Literate Population
P = Total Population
Thus, to know the literacy ratio, the literate population of any area is divided by total population and then multiplied by 100.
Literacy has a strong relation with economic, social and cultural development. In developed countries, the literacy ratio is high when compared with underdeveloped countries due to their social, economic and political situations. In urban areas, the literacy ratio is higher than in rural areas.
Rural people lack the benefit of education because they are engaged in agricultural operations and also due to inadequate opportunities for education there. Moreover, poverty is an important factor in keeping the people illiterate or less educated. Lack of monetary means for meeting the expenditure on education also affects the literacy ratio.
In underdeveloped countries, female literacy ratio is low due to their low status and orthodox beliefs and backward social standards. Large size of families, population increase and poverty are also responsible for illiterate females.
Sex-wise Percentage Ratio of Literacy:
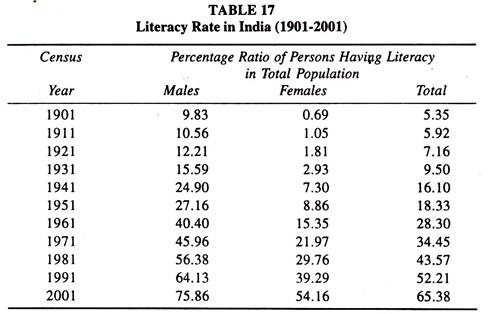
In India, the sex-wise percentage ratio of literate persons in total population is shown in Table 17. In India, the number of literate males is more as compared to females. In 1901, the number of literate males in total population was 9.83 per cent and the number of literate females was 0.69 per cent.
Thus the total literates were 5.35 per cent. In 1951 when India started economic development through planning, the number of literate males was 27.16 per cent and of literate females 8.86 per cent, the total literate persons being 18.33 per cent. This number increased in 1961 and 1971 when the total number of literate persons increased from 28.30 per cent to 34.54 per cent. In 1981, the total number of literate people was 43.57 per cent which increased to 52.21 per cent in 1991 and 65.38 per cent in 2001. Thus, the total number of illiterate persons in India was 34.62 per cent, according to the 2001 census.
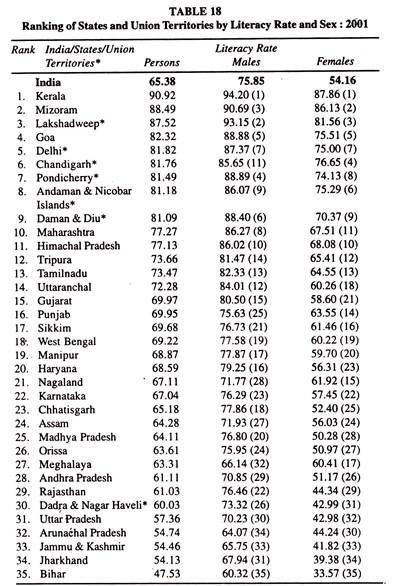
Ranking of States and Union Territories by Literacy Rate and Sex:
Table 18 presents total and sexwise ranking of States and Union Territories by literacy rates in 2001. Literacy rates for persons of all the States and Union Territories have been arranged in descending order while for males and females the ranks have been mentioned in brackets.
Kerala holds the first rank in India with 90.02 per cent literacy rate and also for both males and females, with 94.2 per cent and 87.86 per cent respectively. Mizoram with 88.49 per cent and Lakshadweep with 87.52 per cent hold the second and the third rank respectively.
While Bihar with 47.53 per cent literacy rate was at the bottom in the country. Even for males (60.32 per cent) and females (33.57 per cent), Bihar ranks last in the country.
Jharkhand with 54.13 per cent and Jammu and Kashmir with 54.46 per cent literacy rate are just one and two steps above Bihar from the bottom. The States like Bihar, Jharkhand, Jammu and Kashmir, Arunachal Pradesh, Uttar Pradesh, Dadra and Nagar Haveli are those in which the literacy rates for persons as well as for males and females are below the national average of 65.38, 75.85 and 54.16 respectively, as shown in Table 18.
Essay # 10. Expectation of Life at Birth:
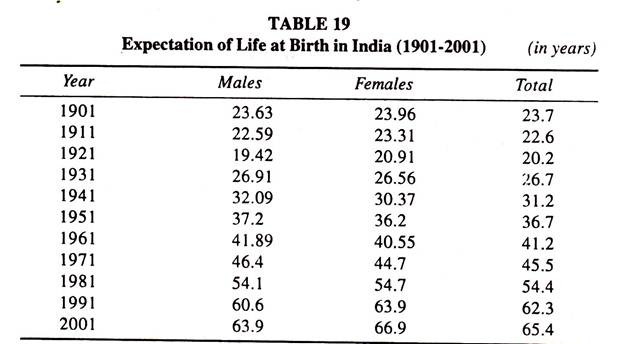
The average number of years a new born child is expected to live under current mortality conditions is called expectation of life at birth. A low life expectancy reflects that the country is poor and lacks in basic amenities of life for human development. Life expectancy increases with economic development and rising standard of living of the people when they are provided all amenities of life.
During the British rule it rose from 24 years in 1901 to 32 years in 1941. When India launched its planned economic development in 1951, it was 32.5 years. Over the years, it increased to 63.3 years during 1996-2000, as shown in Table 19.
One of the important features of life expectancy in India had been contrary to biological expectations of life, woman having a longer life. Right from 1901 census to 1971 census, life expectancy of males was higher than females. It is only from the 1981 census that life expectancy of females has been more than males.
It was 54.7 years for females as against 54.1 years for males in 1981 which increased to 66.9 years for females and 63.9 years for males in 2001.
Essay # 11. Population Problem of India:
The population problem of India is one of rapid population growth or population explosion. This is due to high birth rate and low declining death rate. during 1901-1951, the population grew by 12.3 crore, while during the next 50 years from 1951-2001, it increased by 66.6 crore, that is by more than 5 times.
The two main causes for this rapid growth of population have been high growth rate and a large decline in death rate which are discussed as under:
1. High Birth Rate:
Even though the birth rate in India had declined from 41.7 in 1951-60 to 25 per thousand in 1991-2001, it is still very high. There are various social, economic, climatic and religious factors which are responsible for the high birth rate in the country.
They are explained as under:
1. Hot Climate:
India has a hot climate. In such a climate boys and girls get matured for fertility at an early age. The reproductive period of girls begins normally from 11-13 years. Consequently, they have a longer fertility period which has a direct relationship with high birth rate.
2. Universality of Marriage:
Marriage is universal in India. It is considered a social and religious obligation for the parents to marry their children. Unmarried persons are looked down by the society and universality of marriage results in greater fertility and increasing population.
3. Child Marriage:
The average age of marriage among both males and females is very low in India. Naturally, the number of women in the reproductive age is large.
4. Social Customs and Religious Superstitions:
Social customs and religious superstitions are also responsible for high birth rate in India. A woman without a child is looked down by the society. Generally, her husband remarries. Moreover, the Hindus believe that everyone must have at least one son otherwise the parents are supposed to be deprived of certain benefits in the next world. Parents having many daughters want to have a male child. This tendency results in high birth rate.
5. Joint Family System:
Joint family system is prevalent particularly in rural areas which is also a major cause of high birth rate. In the joint family system, the burden of a child is not borne by the parents but by the head of the family. So the parents do not think about the increasing responsibilities associated with every new born child and beget more and more children.
6. Rise in Natural Fertility Rate:
The fertility rate among young married women has been rising gradually in India. This is due to (1) improvement in nutrition and health of couples; (2) the traditional social and religious checks on fertility have been declining; and (3) the duration of breast feeding to infants by mothers has also been reduced. Naturally, a rise in the marital fertility rate results in a high population growth rate.
7. Low Level of Education:
Low level of education is a major cause for the fast growth of population. According to the 2001 census, only 65.38% of India’s population was literate, of which female literacy rate was lower than that of males. There is a direct and positive relation between illiteracy and marital fertility. Illiterate people do not know the importance of family planning. They consider controlling the birth as a sin. They have no desire to increase their standard of living. So they do not feel the necessity of keeping a small family which leads to high birth rate.
8. Lack of Entertainment Facilities:
Three fourth of our population lives in villages where people lack entertainment facilities. Moreover, the majority of our population lives below the poverty line and they have no money to spend on entertainment. So sex being their only source of entertainment, it leads to more births.
9. Low Level of Family Planning Practice:
There has been absence of conscious family planning in India due to poverty, illiteracy and ignorance about family planning methods. The parents belonging to low-income groups think that their children will increase their incomes by doing even odd jobs.
Moreover, the use of contraceptives has been practically unknown, particularly in rural areas. There has been a consistent shortage of cheap, easy to use and harmless means of birth control. Moreover, social and religious factors are also responsible for not widely accepting family planning by the couples.
10. Poverty:
In poor families, the arrival of an additional child is considered as a source of additional income and means of social security. A child starts to work at a very young age to supplement family income. As the poor people have no assets for their economic security, the children provide security to their parents in old age. As a prominent sociologist, Mahmood Mamtani has remarked, whilst the rich farmers invest in machines, the poor villagers invest in children. That is why, poverty itself is a potent cause for high birth rate in India.
2. Decline in Death Rate:
There has been a rapid decline in death rate in India since 1921. It has almost approached the rate which obtains in the developed world. The world average death rate in 1999 was 9 per thousand. During the period 1911-21, the death rate was 48.1 per thousand whereas in 1991-2001 it was 8 per thousand.
The causes of rapid decline in the death rate are as follows:
1. Improvement in Medical Facilities:
There has been much improvement in medical facilities in India. Hospitals, primary health centres, doctors and other medical facilities have been extended by the state and private sector. With the advancement of medical sciences and technology many dreadful and chronic diseases such as cholera, plague, smallpox, typhoid, etc. no longer hold a threat. Antibiotics and other life-saving drugs have drastically reduced the number of deaths.
2. Improvement in Standard of Living:
Our economy has been developing fast since independence. We are not only self-dependent in food grains but also capable of exporting them. That is why, famines have become events of the past. People have become health conscious. They have begun to take nutritious and complete foods with the result that the death rate is on the decline.
3. Improvement in Education and Awareness:
Improvement in educational level, growing awareness and facilities for sanitation and cleanliness have also helped to reduce the incidence of mortality. Better maternity and post-natal care have brought down the infant mortality rate. In 1951, the literacy rate among woman was 8 per cent which increased to 54.2 per cent in 2001. Now, mothers provide better care to their children thereby resulting in decline in death rate.
4. Late Marriage:
The age of marriage in our country has been increased due to the Child Marriage Prevention Act and expansion of educational facilities. Young persons, both males and females, prefer to educate themselves and make a career in order to a have decent living rather than marry early. Girls marrying at a ripe age, give birth to fewer children. So the mortality rates of both mothers and children are on the decline.
