
After reading this article you will learn about:- 1.Introduction to Road Traffic Noise 2. Traffic Noise and Speed 3. Noise Level Fluctuations 4. Typical Noise Levels 5. Sources 6. Effects on People 7. Subjective Response 8. Noise Index 9. Reduction 10. Control 11. Future Prospects.
Contents:
- Introduction to Road Traffic Noise
- Traffic Noise and Speed
- Noise Level Fluctuations
- Typical Noise Levels
- Sources of Traffic Noise
- Effects of Traffic Noise on People
- Subjective Response to Traffic Noise
- Traffic Noise Index
- Reduction of Traffic Noise
- Control of Traffic Noise
- Future Prospects for Reduction of Traffic Noise
1. Introduction to Road Traffic Noise:
Noise from road traffic produces disturbance to more people than any other noise source. Moreover, this menace to health and quality of life has been increasing over the last two decades for a number of reasons.
The most important among these reasons is the fact that the number of road vehicles, and consequently the density of road traffic, has been steadily increasing. In the United Kingdom, for example, the average rate of increase in licensed road vehicles of all types is about 2% per year.
Similarly, the average traffic density of all types of vehicles on the roads of United Kingdom increased from 184.8 vehicles per kilometer in 1967 to 259.4 vehicles per kilometer in 1977. These trends in most countries of the world are significant since the increased number and density of all road vehicles inevitably increases the road traffic noise.
2. Traffic Noise and Speed:
Leaving aside the number and density of road vehicles, the next most important cause of noise on the roads is the speed of traffic. As a general rule, the faster the traffic travels, the greater the volume of noise.
It is ironic from the point of view of traffic noise control that modern road development policy encourages higher traffic speeds. The construction of multi-lane motorways, which has been going on at increasing rates in most developed countries and even in many developing nations during the last few decades, allows large volumes of traffic to travel at sustained speeds up to 112 km/ h for cars and 80 km/h for heavier vehicles.
In addition to the construction of new motorways, the existing roads have also been improved. For example, urban bypasses have skirted towns and urban ring roads and elevated freeways have contributed to the speed of traffic flow in and around built-up areas.
The improvements in the existing and newly-constructed roads have resulted in higher speed limits. On many roads, for example, the speed limits have been raised from 48 km/h to 80 km/h.
Besides higher speeds and road improvements, there is one more factor- related to these two to some extent – which has contributed to the problem of traffic noise. This factor arises from the fact that all these road developments have usually been in urban areas or adjacent to them.
The result is that such improved roads invariably pass through the thickly-populated commercial and residential housing areas, thus producing increased traffic noise for the inhabitants of such localities.
3. Noise Level Fluctuations:
There are a number of operating factors which contribute to the fluctuations in road traffic noise. All vehicles produce noise from their gear boxes and exhaust systems. In addition to this, heavy vehicles also produce rattles, squeaks and vibrations which, in turn, depend on the degree of loading and the age of the vehicle.
The factor of speed and its relationship with traffic noise. Now we come to its effect on vehicle noise. It has been observed and verified by actual measurements that all vehicles produce more engine noise at higher speeds.
In fact, a doubling of engine speed can increase the noise level by about 13 dB (A). A heavy goods vehicle, in general, produces twice as much noise as a private car. Besides engine noise, the noise from tyres also increases with the speed of the vehicle. A wet road can increase the noise level by about 10 dB (A).
The actual pattern of traffic noise on a main road is quite complex. In the first place, there is a general noise level (or background noise) as long as any traffic is moving. This background noise varies with the traffic density and the time of day. In cities and towns, it is common to have regular distinctive peaks in traffic density in the morning and evening as people travel to work and return home, respectively.
On this general noise level, peak traffic noise levels of a few seconds’ duration are superimposed when individual vehicles are passing any given point. These individual noise peaks depend on the size, type and speed of the vehicle. Heavy goods vehicles with diesel engines, for example, are the noisiest vehicles on the road. Electrically propelled vehicles, on the other hand, are the quietest.
4. Typical Noise Levels:
Traffic noise can be accurately measured in dB(A). Since there is so much fluctuation in the level of road traffic noise, these noise levels are often expressed by the L10 (18 hours) index. Some typical road traffic noise levels under various situations are given in Table 1.

Noise levels of the road traffic in some important cities of the world and India (see, for example, Kudesia, 1985; Tiwari and Ali, 1988) are given in Table 2. In this Table, the last entry for Rourkela is based on a recent survey conducted by the present author. The average noise levels for Rourkela have been rounded to the nearest tens.

5. Sources of Traffic Noise:
Major sources of noise for various types of vehicles are shown in Table 3. This table shows also the relative significance of these sources in terms of numbers varying from 0 (virtually negligible noise) to 4 (very loud noise).
Since table 3 is self-explanatory, we note here just a few points about various types of vehicles. In the first place, the differences in the noise levels of various two-stroke motor cycles at a particular speed arise largely due to the differences in the intake and exhaust silencing systems.

The same is true for the four-stroke motor cycles, which are typically nosier, by about 15 dB(A), than average cars. It can be seen from Table 1 that the exhaust noise is least significance for passenger cars. But in the case of excessively noisy cars, the extra noise generally originates from defective exhaust systems.
In the case of sports cars, a common cause of complaint is the low- frequency “roar”. Light vans are usually noisier than passenger cars. The noise levels of these light vans are often aggravated by loose panels, general clatter and poor maintenance.
But the major sources of traffic noise are heavy vehicles. Their noise levels are aggravated by lack of maintenance and careless operation. Among heavy vehicles, buses are generally less noisy than commercial goods vehicles (trucks).
6. Effects of Traffic Noise on People:
The chief effects of traffic noise on people are as follows:
(a) Annoyance,
(b) Fatigue,
(c) Speech interference,
(d) Distraction, and
(e) Reduction in efficiency.
In some cases, road traffic noise at high levels may cause headache, dizziness, impaired circulation and reflex impairment. These effects depend also on the sensitivity of the individual to noise and his or her age.
It is true that road traffic noise does not cause damage to the physical ear mechanism, but it has other insidious effects. Continuous exposure to this type of noise, for example, may speed up the age-induced deafness or presbycousis.
Traffic noise disturbs also the quality of sleep and, in some people at least, may lead to insomnia. At the very least, road traffic noise disrupts relaxation and enjoyment in the home. Social pleasure derived from conversation, listening to the radio and tape recordings and watching the television becomes increasingly difficult as the disturbance from the outside road traffic noise increases.
The governments have made some recognition of the deterioration in the social environment due to traffic noise in some developed countries where this problem is more acute. In the United Kingdom, for example, the Noise Insulation Act of 1973 empowers Local Authorities to make grants to householders affected by excess levels of noise.
These grants can be utilized to offset the cost of sound insulation involving the installation of double glazing and special ventilation.
Claims for such grants are considered if the premises of the persons claiming such grants are adjacent to new or improved roads brought into use since October, 1972, and if the equivalent noise level is over 68 dB(A) averaged over the hours of 0600 to 2400. There is also the provision for discretionary grants for the occupiers of premises adjacent to new roads brought into use after October, 1969.
In India and other developing countries of Asia, Africa and Latin America, the problem of road traffic noise is not so severe. Since there are many other more urgent problems facing these countries, not much attention has been paid by them to traffic noise and not much work has been done in this field.
In developed nations, on the other hand, many estimates and surveys have been made of the extent to which road traffic noise disturbs people. Such surveys have also measured the noise levels to which people are exposed under various conditions.
The Transport and Road Research Laboratory (TRRL) of the United Kingdom, for example, conducted a survey, in 1970, to determine the number of Britons exposed to various levels of noise. The results of the TRRL Report (1970) are shown in table 4.

The Noise Advisory Council of the United Kingdom has recommended in L10 (18 hours) index of 70 dB (A) as the absolute limit of road traffic noise in residential areas. If this limit were accepted, then according to the estimates given in Table 4, 9.7 million British people (17.8% of the total population) were subjected to unacceptable noise levels.
In addition to this, a further 14.2 million people (or 26.1% of the total population) were within 5 dB (A) of the recommended noise limit, which some experts consider to be already too high.
There is every possibility that the situation has already deteriorated since 1970 due to further increase in the volume and density of road traffic, construction of new roads and improvements in the existing ones.
The Fourth Report (1974) of the Royal Commission on Environmental Pollution (UK) had predicted that by 1980,50% of the British population (about 29 million people) would be subjected to unacceptable levels of traffic noise. It is almost certain that a similar situation exists in most developed countries and in the urban areas of many developing countries.
7. Subjective Response to Traffic Noise:
As a general rule, subjective response to controlled noise levels varies considerably. This holds for both the individual assessment of the “quality” of noise and the annoyance caused by fluctuations in noise levels.
In practice, even with vehicle noise levels being within legal limits, a noise level can still be bordering on the difference between “acceptable” and “noisy” on a subjective scale, particularly when it is continuous, as in the case of dense traffic flow.
Typical results of the samplings of subjective response to noise “quality” are shown in Fig. 1 for diesel vehicles, petrol vehicles and motor cycles. These diagrams show a plot of mean subjective rating (average of noise ratings by several people) as a function of the noise level as measured by a precision sound level meter.
For the purpose of the samplings shown in these diagrams, the following numerical subjective rating scale was adopted: 2 = Quiet, 4 = Acceptable, 6 = Noisy, 8 = excessively noisy and 10 = Intolerable.
The legal limits shown in the three diagrams of Fig. 1 for various types of vehicles are the limits recommended in the United Kingdom. These diagrams clearly show that the noise from diesel vehicles and motor cycles is subjectively more annoying than that from petrol vehicles.
Individual tolerance to high level traffic noise is considerably influenced by the appearance and level of peaks in ordinary vehicle noise spectra, and high- frequency peaks in particular, since these are relatively less common. In the typical spectra of vehicle noise, the major noise content lies in the lower to mid audio frequency range and the high-frequency component is relatively small.
Subjective tolerance to noise also varies with location and time of the day. For example, higher noise levels are more easily accepted in traffic areas than in residential areas. The same is true for the greater frequency of high-level noise.
The individual tolerance to high-level noise can also be affected quite significantly by the age of the observer. Although subjective ratings of noise levels at various sites can be obtained quite easily with the help of an appropriate questionnaire, such ratings are not necessarily reliable or valid for general treatment of traffic noise problems or other applications.

8. Traffic Noise Index:
The Building Research Station of the United Kingdom developed an original method for the assessment of the social nuisance caused by road traffic noise. At the heart method is the formulation of an index known as the Traffic Noise Index(TNI). This index is derived on the basis of separating the noise levels exceeded a particular proportion of the time covered by the measurements.
Thus, a noise level which was exceeded 50% of the time covered would indicate a mean noise level. On the other hand, a noise level that was exceeded only over a relatively short period of time, say 10%, would indicate an average maximum noise level. Similarly; a noise level being exceeded over a long proportion of the time covered, say 90%,would indicate an average background noise level.
It is expected that the mean noise level (related to 50% of the time covered) would show poor correlation over a fairly long period of time and can generally be disregarded, except for simple short-term analysis, or when the volume of traffic remains fairly constant.
The same is true for the background noise level (related to 90% of the time covered). It has been found that the results of detailed analysis of traffic noise levels show poor correlations with the background noise level. Even the average maximum noise level (related to 10% of the time covered) does not show very strong correlation.
A much better correlation can be found, however, with a combination of the average 10% and 90% noise levels. In fact, the correlation resulting from this combination is found to be sufficiently high, and can be regarded as a valid and reliable index. The best combination was found to be that of the 10% level minus 0.75 of the 90% level, which in a slightly modified form defines the well-known Traffic Noise Index (TNI):
TNI = 4 [(10% level) – (90% level)] + 90% level – 30 ………..(1)
This form of definition of the TNI, rather than the simple difference of 10% and 90% levels, has been adopted, since it is easier to work with and gives a more convenient number for the TNI. Basically, this index includes the range of noise levels (the difference of 10% and 90% levels) over a period of 24 hours, together with a smaller proportion of the average background noise (the 90% level).
The basic combination is multiplied by 4 to eliminate fractional quantities. Lastly, the quantity 30 is subtracted from the result on the right hand side of Eq. (1) merely to produce a more convenient numerical scale.
Originally, the Traffic Noise Index (TNI) was formulated as a simple design parameter for siting new buildings and other similar applications. However, TNI has a number of limitations. For example, the distance (between a building and the nearly road) required for siting to produce an acceptable value of TNI may be impractical, or even impossible.
When this is the case, one may have to accept a higher noise level in the building due to road traffic or have to take the necessary measures to insulate the building.
Another limitation of TNI in this regard (i.e., the siting of buildings near roads) is that the TNI itself may be subject to change. This will happen, for example, when there is increase in traffic density for any reasons (road improvement, diversion of traffic, etc.).
The most severe limitation of the TNI is encountered in the case when the area involved is a project only. In this case, no actually measured values of the TNI are available (to help siting of new buildings), except on the basis of similarity to existing sites.
These factors can, however, be related to expected TNI values on an approximate basis related to traffic volume. The approximate TNI envelopes related to traffic volume are shown in Fig. 2.

9. Reduction of Traffic Noise:
The most obvious method of reducing the effects of traffic noise on people in residential and commercial areas is to construct houses and commercial buildings as far away from the road as practicable, subject to other restraints. This follows from the well-known elementary fact that the intensity of sound falls off with distance. The attenuation of traffic noise with distance is shown graphically in Fig. 3.
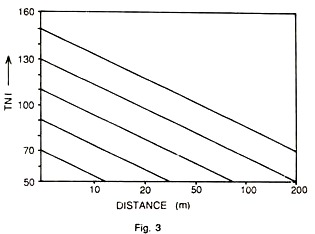
This diagram shows a number of plots of the TNI against the distance (in metres) from the road. The following generalizations can be made regarding the attention of traffic noise with distance from the road:
(a) Over a moderate distance, the 10% level falls off by about 6 dB (A) each time the distance from the source, (i.e., the road) is doubled.
(b) Over a moderate distance, the 90% level, on the other hand, falls by about 3 dB (A) each time the distance from the source is doubled.
The combined effect of these two rules on the Traffic Noise Index is shown in Fig. 3.
The L 10 (18-Hour) Level:
Another very useful index for the estimation of traffic noise, in addition to the well-known Traffic Noise Index, is the “L10 (18-hour)” level. It was specified by the Noise Insulation Regulations (1973) of the United Kingdom as the basis of traffic noise measurement and estimation. “L10” is the sound level, in dB (A), which is exceeded for one-tenth of a period of one hour between 0600 and 2400 hours on a normal working day.
“L10 (18-hour)”, the other hand, is the arithmetic average of all the levels of L10 during a period from 0600 to2400 hours on a normal working day, taken to the nearest whole number in decibels.
10. Control of Traffic Noise:
The nuisance caused by road traffic can be controlled directly by appropriate legislation. Such legislation establishes maximum noise levels for various types of vehicles on a quantitative basis, e.g., maximum sound level in dB (A) measured at a specific distance. This direct method, however, has many limitations. For example, there are difficulties in enforcing such legislation.
Similarly, the standard of noise level recommended for legal purposes offers little in the matter of noise quality. Another fact ignored by such legislation is that the major source of annoyance in the areas of denser traffic is the number of noise sources, i.e., vehicles present on the road at a particular time. Many practical solutions are possible for the effective control of traffic noise.
Some of these solutions are:
(a) The erection of sound barriers between traffic and dwellings.
(b) Severe restriction on traffic movement in built-up areas.
(c) Sound-proofing treatment of the affected houses and commercial buildings.
(d) Re-siting of urban road systems.
(e) Controlling the emission of noise at the source by improving the design of road vehicles.
The first three methods are employed currently in advanced countries to curb the menace of excess traffic noise. This shows that there is no real possibility at present of controlling this noise at the source, although the second method listed above does tackle the problem directly by reducing the number of noise sources.
The third method is positive and quite effective, but it is rather expensive as it involves the carrying out of insulation worm. Moreover, this method is mainly concerned with new constructions.
In addition to the methods questioned above for the control of traffic noise, the following measures may also be found useful in reducing the undesirable effects of traffic noise:
(a) Setting low speed limits for the sections of a highway passing through heavily populated areas.
(b) Establishing alternate routes for heavy vehicles.
(c) Allowing wider separation (or a buffer zone) between a highway and adjacent buildings.
(d) Designing of highway surroundings to absorb noise, e.g., planting of trees on both sides along the highway,
11. Future Prospects for Reduction of Traffic Noise:
What is needed in the future for the reduction of traffic noise are quiter vehicles as well as quiter engines. Road traffic noise could also be reduced to more desirable levels by better control over the flow and volume of traffic. A reduction in the number of heavy vehicles on all roads would considerably reduce noise and in addition, some other environmental problems too.
At present, large quantities of goods are transported by roads in most countries. If some of these were transported by modern fast freight trains, there would be a considerable reduction in traffic noise as well as road traffic congestion.
Such a change would lower the volume of road traffic and, consequently, the need for additional highways. The EEC (European Economic Community) has made a proposal to establish designated lorry routes (in Europe) restricted to certain roads only. If this proposal could be implemented, then lorry traffic and noise would be better distributed. Similar arrangements are needed in other countries too.
In many countries, some Local authorities are using traffic management schemes that aim to exclude heavy vehicles from town centres and residential areas at all times, or at least during the prescribed hours. Such schemes, however, suffer from the limitations that they can only be operated if alternative routes are available, and where they will not cause under traffic congestion.
The alternative routing of traffic is a sound environmental policy. It not only reduces traffic noise, atmospheric pollution and vibrational damage to buildings, but also helps road safety. Similarly, restricting the construction of bypasses (for trunk routes) and new highways in rural areas will improve the quality of life for the inhabitants of small towns and villages.
Authorities usually do not give enough consideration to environmental effects when planning and developing new roads or improving the existing ones. Besides other factors, town planners should always assess traffic volume and noise volume, when planning new highways.
They should be obliged to ensure that the minimum number of people are exposed to the hazards of road traffic noise. Attention should also be given to the orientation of buddings with respect to main roads, and the use of landscape features to act as sound barriers and absorbers of traffic noise.